I. Introduction
This report presents a summary assessment of the environmental situation and challenges facing Trinidad and Tobago at the present time and over the next half-century. The report uses data from standard sources to make a series of projections of population, arable land, forested land, and population carrying capacity for the nation. These projections show that if current population growth and resource utilization trends continue over the next several decades as in the past, the size of the gap between Trinidad and Tobago's population and the population carrying capacity of the available arable land will increase substantially. In the near-term future, this difference will bring to bear continued and increasing pressure to continue the clearing of the nation's forests. In the long run, the large gap between projected population and the carrying capacity of the land suggest that the potential for severe environmental degradation in Trinidad and Tobago is very high.
This report presents solely a summary assessment of the current and future situation; it does not identify, describe, evaluate, or recommend policy actions that can address the situation. The development of suitable policy actions will require much additional analysis, a high level of coordination among the various sectors of the nation, inspired leadership, and participation of the nation's citizens in making and implementing difficult and far-reaching decisions.
The summary assessment of this report reveals that a daunting task faces Trinidad and Tobago's environmental planners and managers, if the island nation is to avoid massive environmental damage in the not-too-distant future. This report is based on projections of current trends on population growth and resource utilization. If steps are taken to change those trends, the prospects of a bleak future can be changed. With clear vision and bold action, the Government of Trinidad and Tobago can succeed in preserving an environment in which the human population of Trinidad and Tobago can thrive in harmony with nature.
II. Data Sources
Environmental problems are particularly difficult to address because they are regional in scope, involve many different sectors, and are dynamic (evolve over time). Because the environment is part of a large, complex, dynamic system, a "systems" approach is required to develop a clear understanding of the problems and develop satisfactory strategies for addressing those problems. Assessment of environmental problems involves the physical sciences of physics, chemistry, biology, geology, and meteorology. In addition, however, viable solutions to environmental problems are critically dependent on economic, political, and sociological factors as well.
The summary assessment presented in this report makes no attempt to describe Trinidad and Tobago's environment in detail, and it describes the environmental situation only in broad macroscopic terms. It examines the salient features of the nation from the points of view of population, agricultural resources, and economics, to obtain a rough picture of the current and future situation. This situation assessment utilizes data that are readily available from standard sources on the most important factors affecting the environment. More detailed and refined analysis will no doubt involve the use of much more detailed data on a much wider range of factors.
The principal data used in this report are vital statistics, demographic, economic, and environmental data available from publications of the United Nations and World Bank, such as the World Development Report 1994 (Reference 1), The State of World Population 1994 (Reference 2), and Family Planning and Population: A Compendium of International Statistics (Reference 3), and World Resources 1994-95: A Guide to the Environment (Reference 4). Additional references are listed in the list of references at the end of the report. Throughout this report, the source of each data element used will be provided. In many cases, more detailed or more recent may be available from sources in Trinidad and Tobago (which were not available for this quick assessment). Examples include detailed age-structure data, life tables, regional data (e.g., regional economic data, urban/rural data, environmental data), and racial/cultural data (e.g., race-specific fertility and mortality rates).
Appendix A contains a detailed presentation of all of the data used to make the population projections used in this report, and Appendix B contains a table containing all of the population and other projections (arable land, forested land, arable-land productivity, and carrying capacity). Appendix C presents a summary of some basic environmentally related statistics about Trinidad and Tobago.
III. Projection of Arable Land Area
One of the most important factors affecting the environment is the availability of arable land. If a country's available arable land is sufficient to feed the population, the pressure on the environment is substantially less than if it is not. If the gap between a nation's food needs and its food production resources widens, the nation may make up the shortfall by purchasing food on the world market. In the long run, however, nations of modest economic means must rely heavily on their own resources. As population increases, pressure is placed on agricultural land (forested and arable land) in two ways -- for food production and for physical living space.
This section projects the availability of Trinidad and Tobago's agricultural land resources -- its arable land (cropland) and forests. It does not examine marine food production, since this is a relatively small component of the nation's food supply (Reference 1: 3.6% of total daily protein supply from fish products). The projections made in this section are based on the assumption that current trends in population and agricultural resource utilization continue.
The total land area of Trinidad and Tobago is 5,128 square kilometers (Reference 5). In 1986, the Food and Agriculture Organization of the United Nations reported (Reference 6) that 23% of Trinidad and Tobago's total land was arable -- a total of .23 x 5,128 = 1,179 square kilometers. Reference 4 reports the amount of cropland in 1991 as 1,200 square kilometers -- about the same. Reference 4 reports that the amount of cropland has increased by 3.4% from 1979-81 to 1989-91. (This corresponds to a figure of 1,161 km2 for 1980.)
Major factors affecting the availability of arable land are water availability (for irrigation) and deforestation. Reference 6 reports that in 1986, 19% of the arable land area was irrigated, or .19 x 1,179 = 224 square kilometers. Reference 4 reports that over the periods 1979-81 and 1989-91, irrigated land comprised 18% of cropland. Further, it reports that the annual withdrawal of water resources was 3% of total freshwater resources, of which 35% is used in agriculture, 38% in industry, and 27% in domestic uses. In view of the relatively low withdrawal of total reserves, it does not appear that water availability is a major constraining factor on availability of arable land.
Reference 6 reported that in 1986, 44% of Trinidad and Tobago's total land area was forested -- .44 x 5,128 = 2,256 square kilometers. Reference 4 reports that the total forest and woodland in 1989-91 was 2,200 km2, and that this was a change of -4.3% from 1979-81. Reference 4 reports that the total forest area (which is natural rain forest) was 1,550 km2 (30%) in 1990 and 1,920 km2 in 1980, corresponding to an average annual rate of deforestation of total forest over the period 1981-90 of 37 square kilometers, or 1.9% (2.2% compound rate). Reference 1 reports that only 200 square kilometers is nationally protected.
These statistics show that Trinidad and Tobago is being deforested at a very rapid rate. If the rate of deforestation experienced over the last decade continues, destruction of Trinidad and Tobago's remaining natural forest will be total within 40 years.
Deforested areas may be converted to agricultural uses, such as tree farms (plantations) or cropland, depending on the nature of the soil and availability of agricultural inputs (water, fertilizer, pesticides, equipment) and demand for alternative uses (e.g., roads, housing). According to the data on deforestation and arable land availability over the past decade, the extensive deforestation has not been associated with an increase in the amount of arable land. This is not surprising, in view of the nation's high population growth rate -- 1.2% per year in 1960-65, 1.3% in 1985-1990, and 1.1% in 1990-95 (Reference 3). The rate of population growth in Trinidad and Tobago is comparable to the rate of deforestation (1.3% vs 1.9%). In view of the data, the massive deforestation of Trinidad and Tobago is not being accompanied by a concomitant increase in the amount of arable land. (It would appear that the deforested land is either not arable, not being used as arable land, or is being used to offset comparable losses of arable land (e.g., to provide nonagricultural land for the increasing population), but readily available data shed no light on this; local data would reveal the extent to which these factors pertain.)
Based on recent historical data, the amount of arable land in Trinidad and Tobago is hardly increasing at all (3.4% increase from 1980 to 1990), despite rapid destruction of natural forest. There is certainly a pressing need for additional arable land, in view of the substantial importing of cereals over a long period (Reference 1: 252,000 metric tons in 1980 and 246,000 metric tons in 1992), and a stagnation in food production per capita (Reference 1: -.1%/year for 1979-92). Fertilizer inputs are and have been high (Reference 4: 66 kg per ha in 1979-81 and 67 kg/ha in 1989-91), and yields are relatively high (Reference 4: 2,833 kg of cereals per ha in 1990-92). The fact that the amount of arable land has not increased in the face of long-term high-level cereal imports and substantial destruction of natural forests suggests that the amount of available land will not increase in the future.
It may be reasonably hypothesized that the historical high level of deforestation is a major factor underlying the fact that the amount of arable land has remained essentially constant, in spite of high population growth. In view of this, it may reasonably be conjectured that the amount of arable land will decrease, once the natural forests are completely destroyed (in order to provide living space for the increasing population).
In view of the experience over the past decade, in which the amount of arable land has not increased despite high demand for food and extensive destruction of natural forest, it appears reasonable to expect that the amount of arable land will remain constant at 1,200 square kilometers until all of the natural forest is destroyed, and will decrease thereafter.
Note that some portion of the deforested land may become available for use as arable land. While some deforested land may indeed be used for crops, the net increase in arable land over the period 1980-90 (i.e., arable land increases less arable land decreases) was only 3.4%, or .335% per year. This corresponds to just 4 km2 per year, or about 10% of the amount of deforested land.
In view of the preceding considerations, a reasonable assumption concerning the future availability of arable land (in the near future) is that (1) it will remain essentially constant as long as the population continues to grow and the current rapid destruction of natural forests continues; and (2) if deforestation ceases (either because of the complete destruction of the forests or other factors), the arable land will decrease by an amount proportional to the amount of population increase.
Because the destruction of forest has continued at a high rate for a long time, it will be assumed that this destruction continues (at the same amount per year). At the end of 40 years, the forest will be gone. Currently, the population is increasing at 1.1% per year (Reference 2), or about 14,300 per year, and the forest is being destroyed at a rate of 37 square kilometers (3,700 ha) per year. This corresponds to a loss of .26 hectares of agricultural land per unit increase in population.
An issue to address is the rate at which arable land will be destroyed after the forest destruction is complete. During recent decades, the population has grown at the annual rate of 1.1-1.3% per year (Reference 3). During this period the amount of arable land has remained about the same, and the amount of forested land has decreased by about 1.9% per year. During the period in which the forest has decreased by 1.9% per year and the population has grown by about 1.2% per year, the change in the non-arable, non-forest area has been about 1.7% per year. This is shown in the following table (areas in square kilometers):
Total Forested Arable Other Other Land
Year Land Area Land Area Land Area Land Area Area (%)
1980 5,128 1,920 1,200 2,008 .39
1990 5,128 1,550 1,200 2,378 .46
The change from 2,008 to 2,378 over a ten-year period is an annual (compound) growth rate of 1.7%. During this period, the economy of Trinidad and Tobago has been relatively stagnant, so that the loss of agricultural (arable + forested) land area cannot reasonably be attributed solely to or even mainly to economic pressure. Rather, a significant portion of the loss would appear to be associated simply with the physical requirement for living space for the additional population (housing, roads, businesses, government, schools, and other infrastructure).
The average annual loss of agricultural land is about 37 km2 per year. At an annual growth rate of 1.1% (net of migration), the population of 1.3 million is increasing by about 14,300 per year. As noted, this corresponds to an annual loss of .26 ha per person (37x100/14300) for living space.
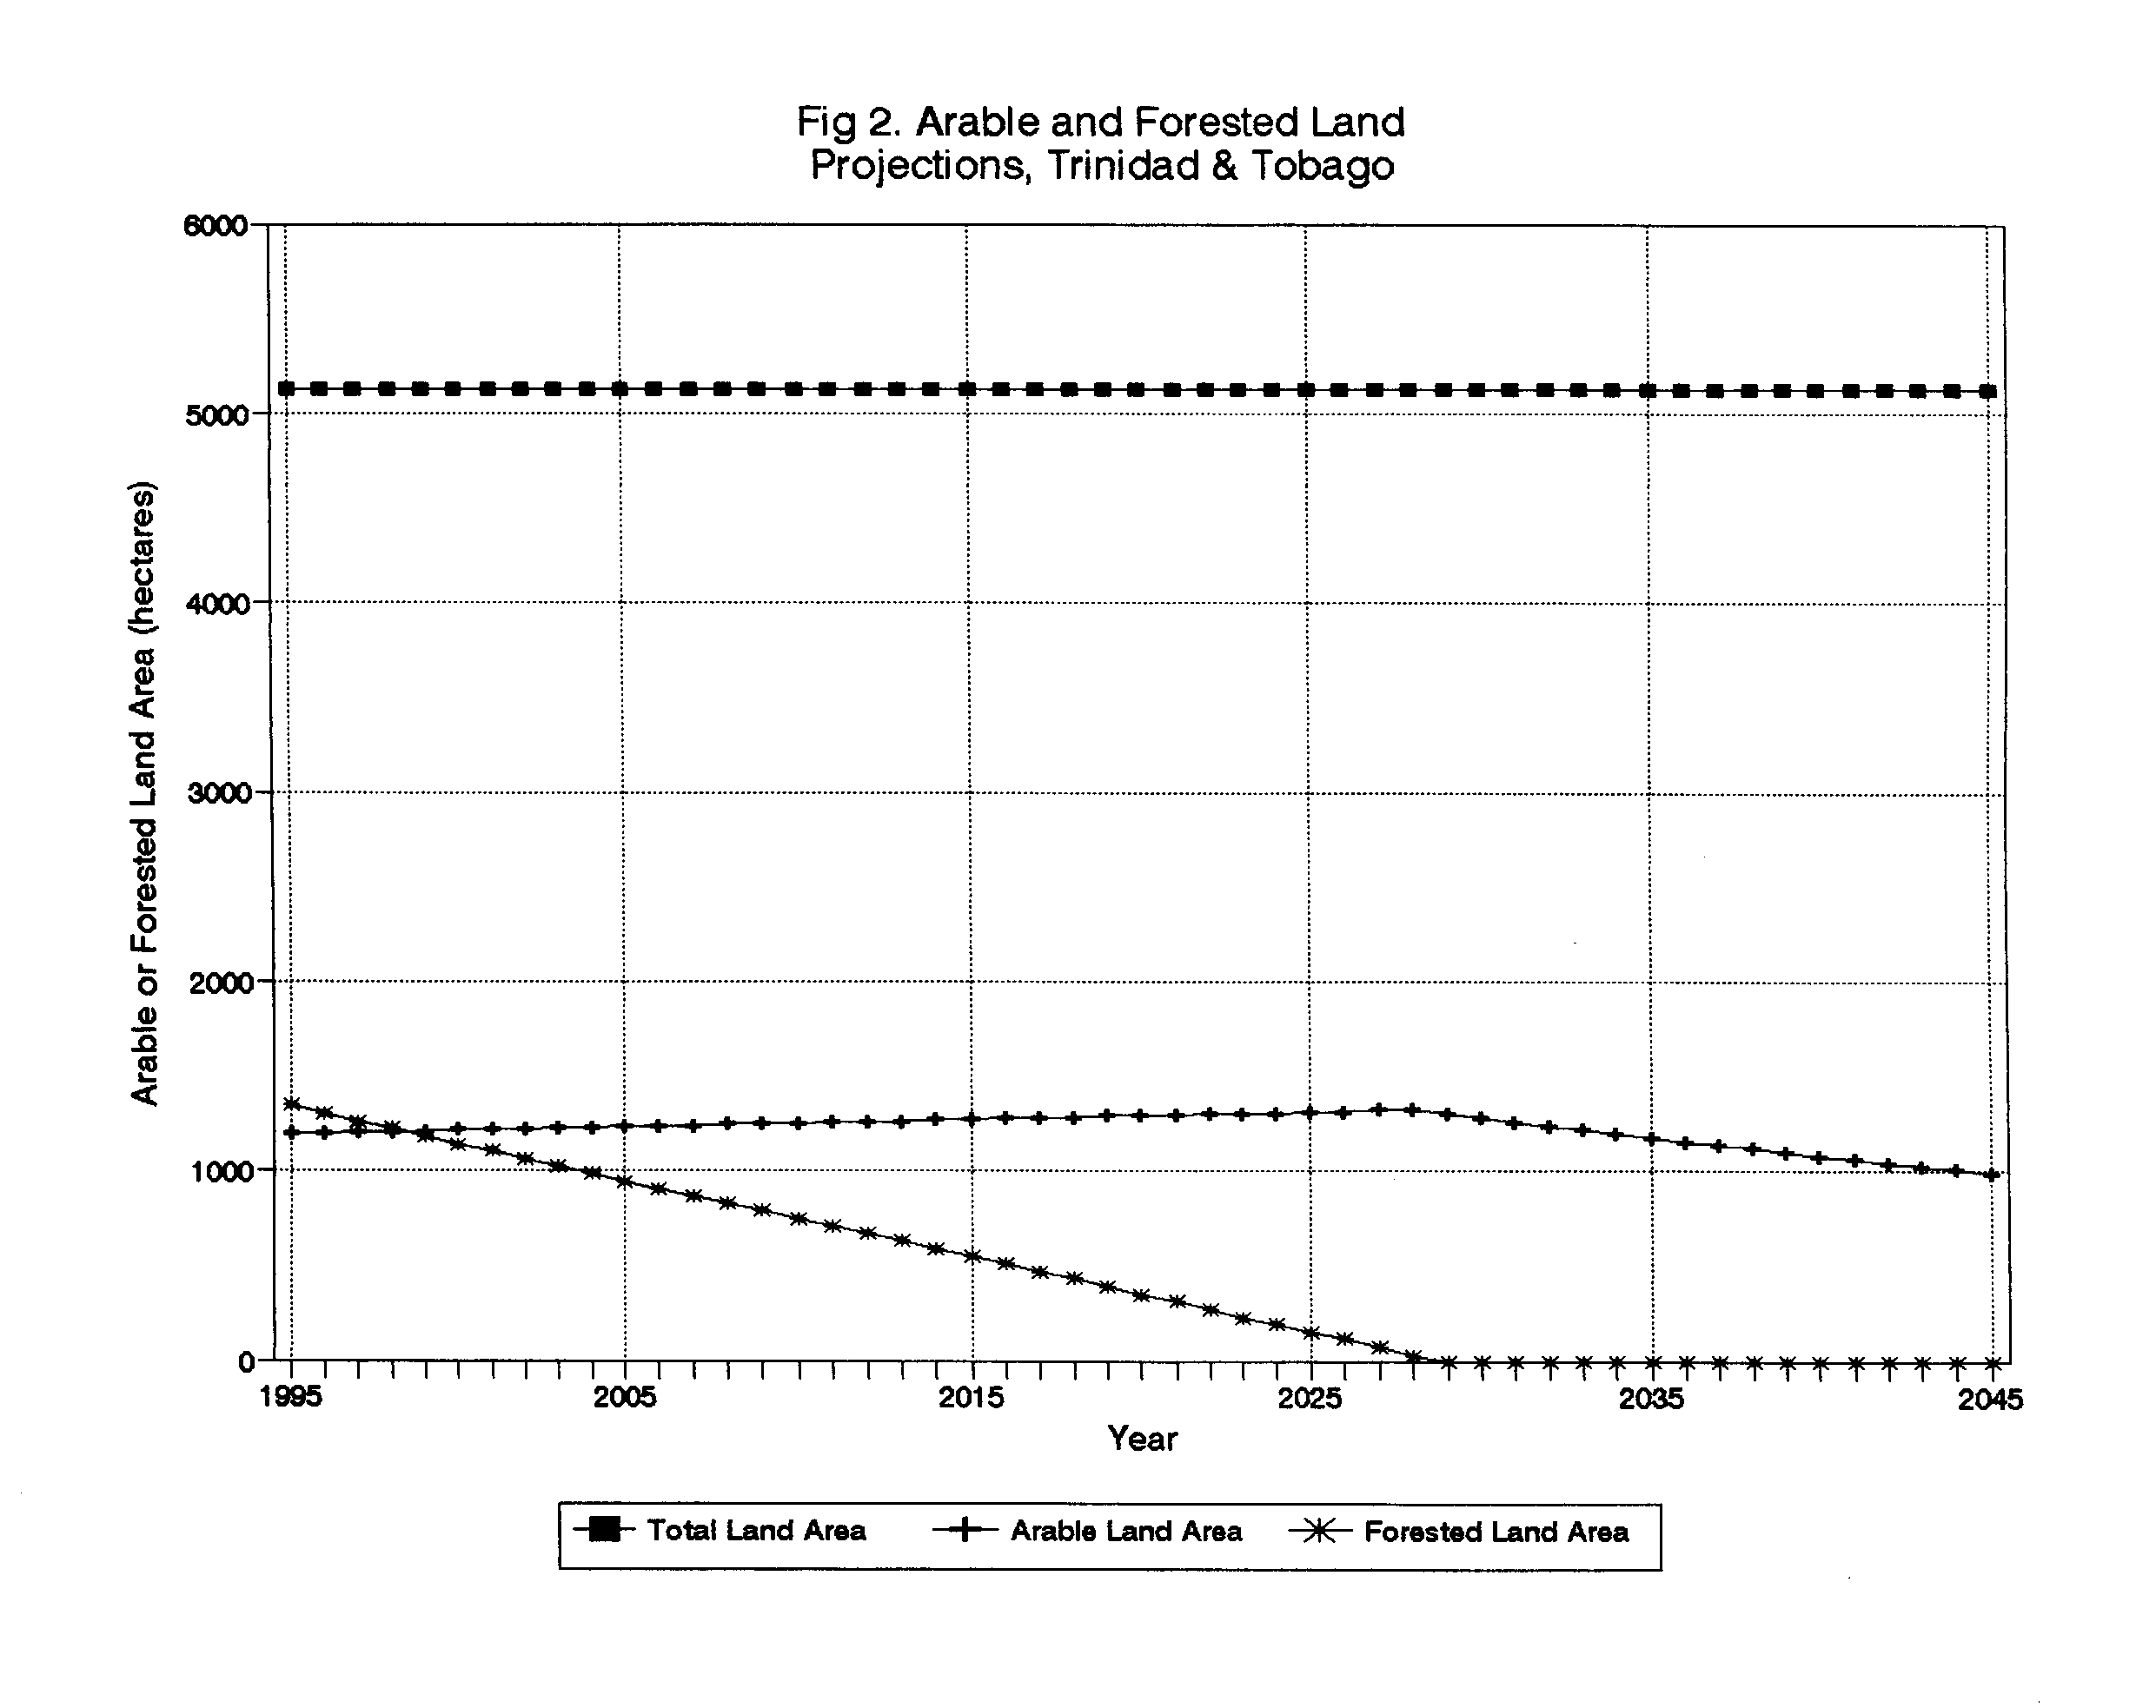
In the absence of a thorough analysis of detailed and comprehensive data on the subject, it is not possible to predict with a high degree of certainty what changes will occur in the amount of arable land in the future. If the population continues to grow at current rates, it seems likely that it will remain somewhat unchanged for the near future (while forests remain), and then decrease (after the forests are gone). For the arable-land projections used in this report, it will be assumed that the amount of arable land will increase by 10% of the deforested area (3.7 km2) per year until the forests are totally destroyed, and that the amount of arable land will decrease at 1.7% per year thereafter, as long as population growth continues at current levels. This assumption corresponds to the assumption that recent trends in population growth and deforestation continue as in the recent past.
This assumption is somewhat optimistic in one sense, since it ignores the long-term loss of agricultural productivity (soil depletion) of the land. (In most countries of the world, cropland is being depleted much more rapidly than it is being replenished.) More importantly, it ignores the fact that population growth cannot continue at any positive rate indefinitely. At some point, the population would cover the entire land area. With Trinidad and Tobago's current large population and high growth rate, the period of rapid continuing positive population growth is nearing an end. While current growth rates could continue for a few decades more, the environmental changes associated with such growth would be massive. Trinidad and Tobago's current agricultural resources are barely sufficient for its current population, and the nation relies heavily on food imports. Over the next several decades, the cost of food imports is expected to rise dramatically, as world fossil fuel supplies dwindle and world population soars. In terms of gross national product (Reference 1: USD3,940 in 1992, compared to US = USD23,240), Trinidad and Tobago ranks 100 out of 132. In terms of purchasing power parity per capita, Trinidad and Tobago's rating is 40 (where US corresponds to 100) (also Reference 1). At this economic level, Trinidad and Tobago will find it increasingly difficult to purchase food on the world market.
In summary, it is unreasonable to project either that Trinidad and Tobago's population will continue to grow indefinitely, or that its arable land will totally disappear. More reasonable projections would be based on a "systems" model that takes into account the interrelationships among population, the environment, and the economy, not on extrapolation of current trends. While present trends cannot continue indefinitely, they may continue for some time, and indeed to the point at which massive environmental changes occur -- this has already happened in many countries around the globe. Extrapolation of current trends is useful not for making reliable estimates of actual levels at times far in the future, but for showing the environmental implications of continuing current behavior and practices.
Figure 1 illustrates recent levels of Trinidad and Tobago's agricultural land (arable and forested). The figure plots the data described above, and graphically depicts the negative association between population growth and reduction in agricultural land area.
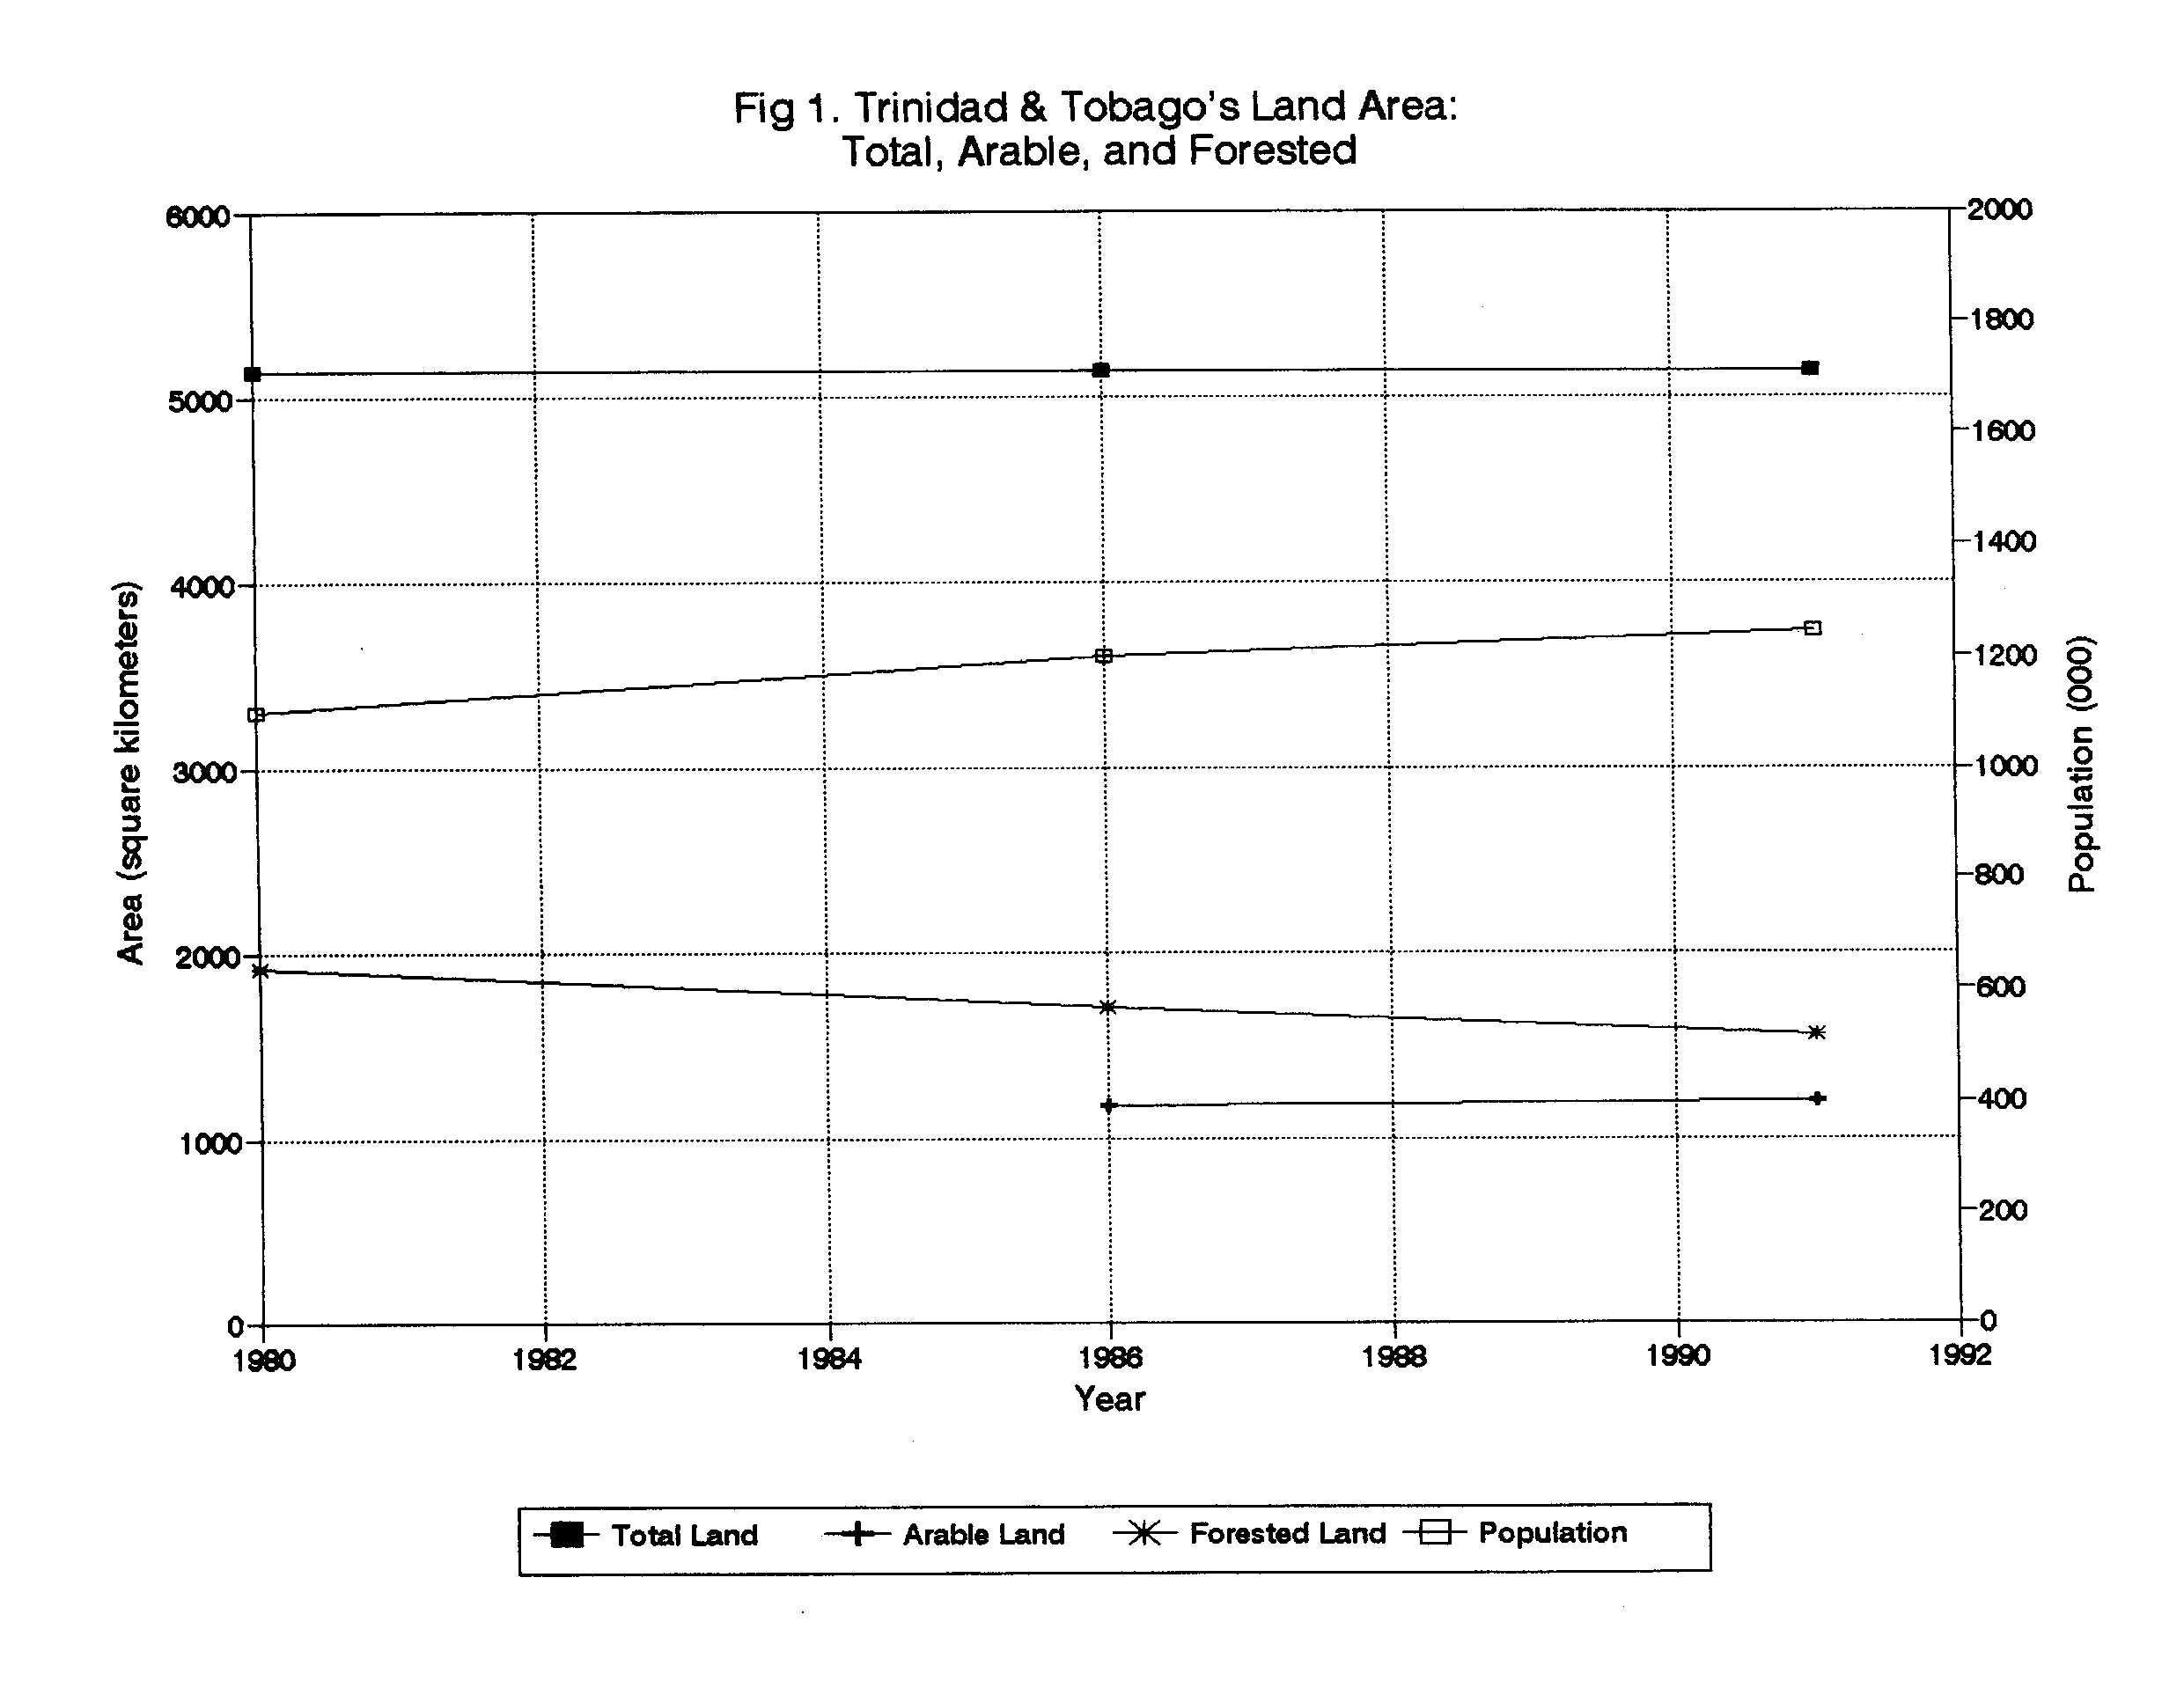
Figure 2 illustrates the projection of arable and forested land area in Trinidad and Tobago, under the assumptions discussed above.

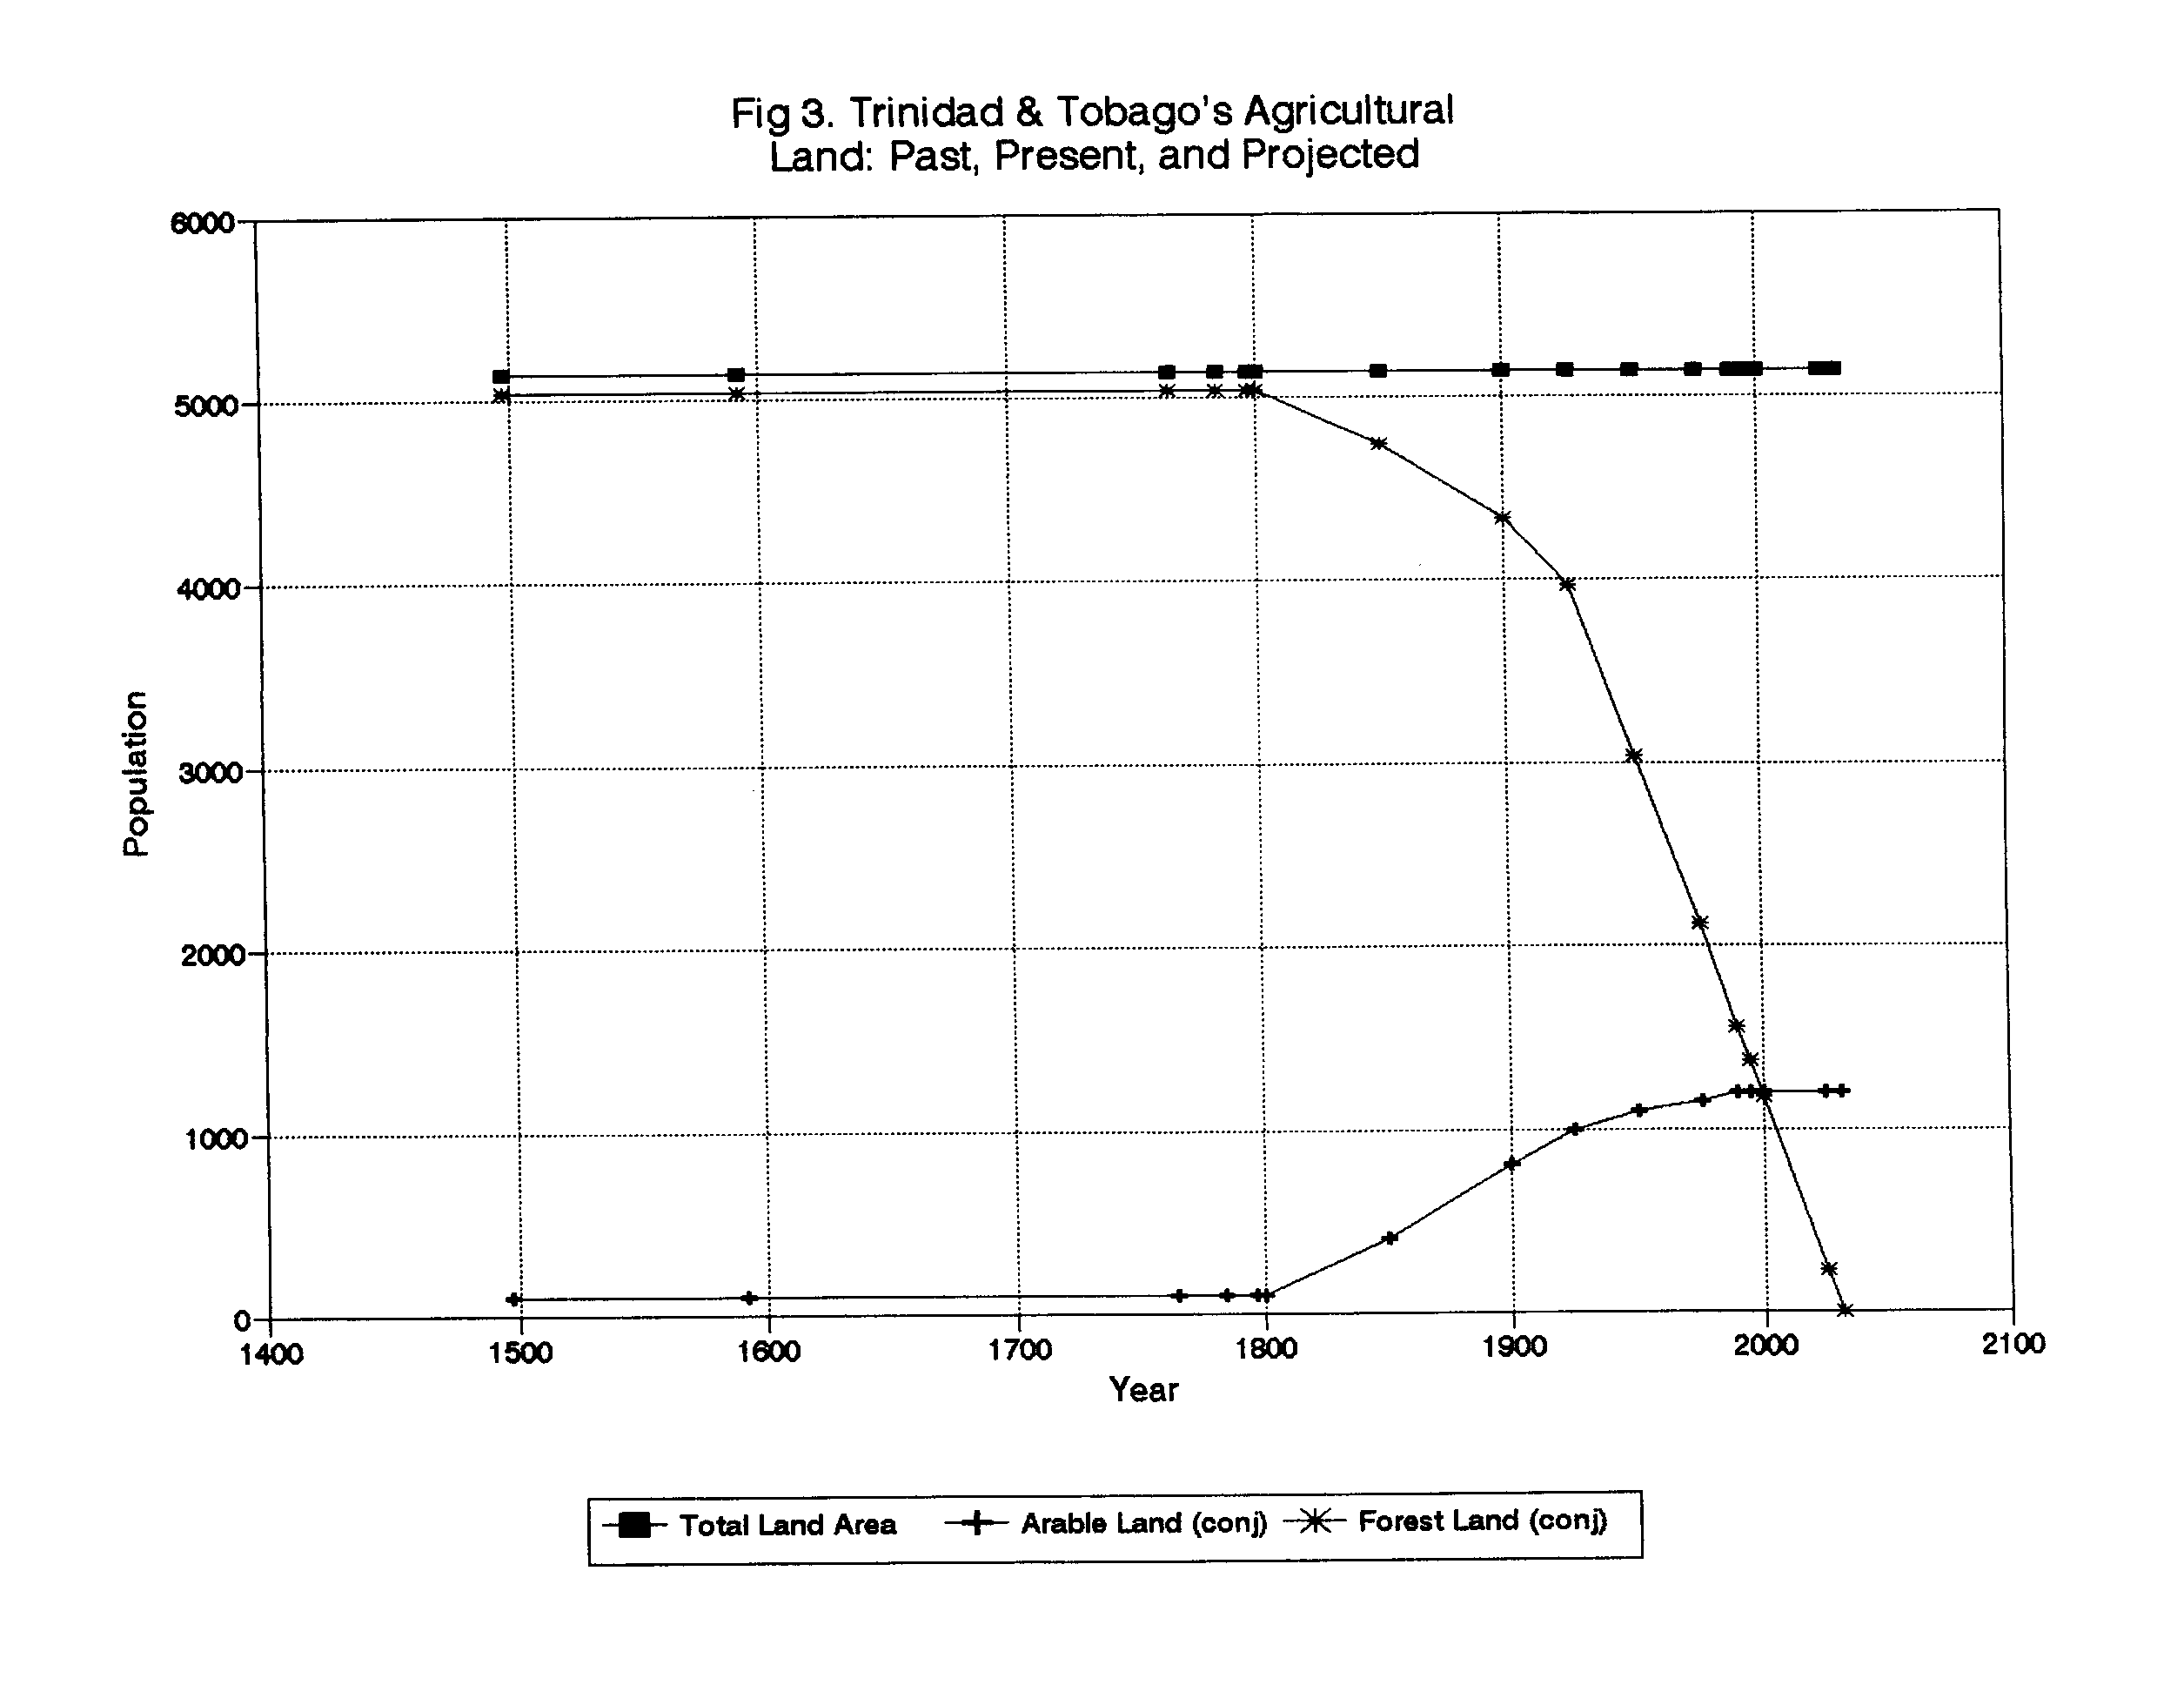
Neither Figure 1 nor Figure 2 place the current and projected levels of arable and forested land in historical perspective. In studies dealing with population, changes occur very slowly, generally on the order of a few percentage points per year. At such low rates of change, it is not easy to grasp the magnitude of the changes that are occurring over long periods of time, or to assess the reasonableness of the projections from a macroscopic point of view. To look at Figure 1, for example, the rate of change of both population and forested area is hardly noticeable. To place the data of Figure 1 and Figure 2 in a better perspective, they are plotted in Figure 3, which covers a much longer time period.
A problem that arose with respect to Figure 3 is that data were not available to this report on historical arable-land and forested-land areas prior to 1980. To enable the construction of a tentative version of Figure 3 (pending access to historical data), the historical levels of arable-land and forested-land were conjectured. Several hundred years ago, most of the land area was forested, and the amount of arable land was probably on the order of 100 km2 until about 1800. From 1800 to the present era, the amount of arable land increased to its present 1,200 km2. In recent times, deforestation has been occurring at an average rate of about 37 km2 per year. Combining these features (by extrapolation, interpolation, and smoothing) results in the graph presented in Figure 3. This graph illustrates dramatically the impact that human population has had in changing the nature of the land area of Trinidad and Tobago, and that the nation is in the final stages of destroying its natural forest.
IV. Projection of Carrying Capacity
While the amount of arable land is a major factor determining agricultural output, the productivity of the land is just as important. The agricultural productivity of land depends on many factors, including availability of water, natural productivity, climate, fertilizer, pesticides, energy, variety, and capital equipment. With respect to impact on the environment, the essential factor is the carrying capacity of the land -- the number of persons that the land can feed. This factor may be measured as number of persons who can be supported per hectare of arable land, or the maximal arable-land population density. This number is affected greatly by the type of food consumed -- the "trophic level" of the consumption. As population grows to the limit of the food supply, efficiency is increased by increasing consumption at a low trophic level, such as by eating more cereal grains and less meat.
We shall refer to the maximal arable-land population density of land when used at a low tropic level of consumption (i.e., use of arable land for cereal production rather than meat production) as the "productivity" of the land. With a high level of energy inputs, the productivity of arable land is high, e.g., 10 persons per hectare. With low inputs, the productivity is much lower, e.g., 2.5 persons per hectare.
Apart from the trophic level of consumption, the main factor influencing arable-land productivity is the level of energy inputs to agriculture. The term "energy inputs" includes all energy-related inputs, including fertilizer, pesticides, irrigation, biological inputs (e.g., high-yield varieties) and mechanization (both equipment and fuel). In order to project the arable-land productivity, and hence the carrying capacity of the land, it is necessary to examine and project the availability of energy inputs to agriculture in Trinidad and Tobago over the next several decades.
As long as world fossil fuel supplies last, a strong economy can purchase sufficient inputs to produce a high level of productivity. As oil and natural gas reserves deplete over the next 50 years and world population growth continues, the cost of energy inputs will skyrocket, and few countries will be able to afford to purchase these inputs. At that time, the land productivity will drop to pre-industrial levels for most nations without domestic coal reserves. Trinidad and Tobago has not realized economic growth in recent years: Reference 4 reports an average annual growth rate of -3.9% in gross national product for the period 1980-91 and an average annual growth rate of -4.4% in gross domestic product over the same period.
Trinidad and Tobago's domestic energy reserves consist of 80 million metric tons of crude oil and 252 billion cubic meters of natural gas (Reference 4). Its current commercial energy production is 533 petajoules (PJ, or 1015 joules). Its annual commercial energy consumption is 296 PJ. The conversion rate for oil and gas to petajoules is 1 million metric tons of oil = 41.87 PJ and 1 billion cubic meters of natural gas = 38.84 PJ. Converting the physical reserves to petajoules yields 3,350 PJ of coal and 9,788 PJ of natural gas, for a total of 13,138 PJ.
As a percentage of consumption, exports are 76%, or 225 PJ. At current production rates, Trinidad and Tobago's energy reserves will last 13,138/533 = 24.6 years. If production is increased, either because of an increase in domestic consumption or exports or both, the years of production will decrease.
Per capita energy consumption in 1991 was 237 gigajoules (GJ) (Reference 4) versus 320 GJ for the US in the same year. If Trinidadian per capita consumption were to rise to the 320 GJ per capita level, an additional total of (320-237) x 1.3 million = 107,900,000 GJ, or 107 PJ would be consumed annually, if the population remained constant at 1.3 million. This amount is equivalent to about half the current export amount (225 PJ). If the population were to double, all of the export amount would be consumed domestically, i.e., the total commercial energy production would be consumed domestically. If domestic per capita consumption were to rise to 320 GJ per capita, the total domestic consumption would be 1.3(320) = 416 PJ, if the population remained at 1.3 million. If exports were held constant at 225 PJ and domestic per-capita consumption were to rise to 320 GJ per capita, the total annual production would rise to 225 + 416 = 641 PJ. At that rate of production, proven reserves would last only 13,138/641 = 20.5 years. If the population were to double, this length of time would decrease correspondingly. If exports were to increase (e.g., to pay for more food imports at higher prices), the length of time would shorten even more.
In the long run, demand for energy will rise (as fossil fuel reserves deplete), so that demands for exported oil and gas will rise. Currently, Trinidad and Tobago's economy is heavily industrial (Reference 1: 3% of gross domestic product (GDP) in agriculture, 36% in industry, 8% in manufacturing, and 61% in services for 1992, vs. US figures of 2%, 33%, 22% and 65% for 1988, reported in World Development Report, 1990). In 1990, only 7% of the total labor force was agricultural (Reference 4). According to Reference 4, in 1989-91 Trinidad and Tobago imported 254,000 metric tons of cereals, up from 237,000 metric tons of cereals in 1971. In the 1990-92 period it produced only 17,000 metric tons of cereals.
As the preceding computations show, Trinidad and Tobago's proven energy reserves will not last much longer. At that point in time, whatever food (or agricultural inputs to food production) is purchased on the world market will no longer be purchased using foreign exchange earnings from energy exports, since there won't be any. Since Trinidad and Tobago's economy has not grown at the same rate as the population in recent years, and food imports are rising, an important issue to be addressed is how the economy will generate foreign exchange earnings to pay for food imports (or agricultural inputs to its domestic agriculture sector) after domestic energy reserves exhaust.
The implication of these figures is that as Trinidad and Tobago's energy reserves decline, it will, if current trends continue, rather soon reach the point at which it has neither the domestic agricultural capacity to feed its population nor the economic wherewithal to purchase food on the world market. As this situation evolves, the pressure on the land and environment will become severe.
As world oil and gas reserves deplete, the cost of energy inputs to agriculture will soar. As Trinidad and Tobago's own reserves deplete, the nation will transition from an era of high-energy-input agriculture to low- (traditional-) energy-input agriculture. Yields under high-energy-input (HEI) agriculture (fertilizer, pesticides, irrigation, biotechnology, mechanization) are high. At a low trophic level of consumption (i.e., consumption of cereals rather than meat), the maximal arable-land productivity can be about 10 persons per hectare. Yields under low-energy-input (LEI) agriculture are substantially less -- often 10-50% as much. We shall assume that the current arable-land productivity in Trinidad and Tobago with high-energy inputs and a low-trophic level consumption is 10 persons per hectare.
Although it is expected that productivity will decrease in the long run (i.e., over the next 50 years), the rate at which this decrease occurs is subject to conjecture. In recent years, Trinidad and Tobago's agricultural production has decreased on an exchange-rate basis (Reference 1: 6.6% annual decline over the period 1980-92) at twice the rate of gross domestic product (-3.7% over the same period). Although total agricultural production and food production have declined by about 5% on a per-capita basis (Reference 4) over the period 1981-1991, total agricultural production and food production have increased by about 8% over that period (recall that cropland increased by 3.4% over this period). Average yields of cereal production (kg/ha) have decreased by 9% over the same period, and average yields of roots and tubers have increased by 14%.
These figures do not suggest that Trinidad and Tobago's arable-land productivity is currently in the midst of a general decline. In view of the mixed picture, it is reasonable to assume that maximal arable-land productivity will continue at a level of 10 persons per hectare for some portion of the next 50-year period, and then decline to a lower level, e.g., 2.5-5 persons per hectare.
It is acknowledged that assumptions on the timing of the decline of maximal arable-land productivity as energy resources deplete is somewhat conjectural. What is far less speculative, however, is the fact that the world's oil and gas reserves are rapidly being depleted, and it is generally recognized that known global reserves will be depleted within about 50 years at current consumption rates (Reference 4: 45 years for oil, 52 years for natural gas). And, it is a fact that agricultural yields for low-energy-input agriculture are but a fraction of those of high-energy-input agriculture.
With a high level of agricultural inputs, Trinidad and Tobago has arable land resources capable of feeding a substantial proportion of its current population. As the price of agricultural inputs rises, however, the use of productivity-enhancing inputs will decline, resulting in a corresponding decline in the capacity to produce food from domestic arable-land resources. As the population continues to grow, the nation will face an ever-widening gap between food needs and food production and food purchasing capacity.
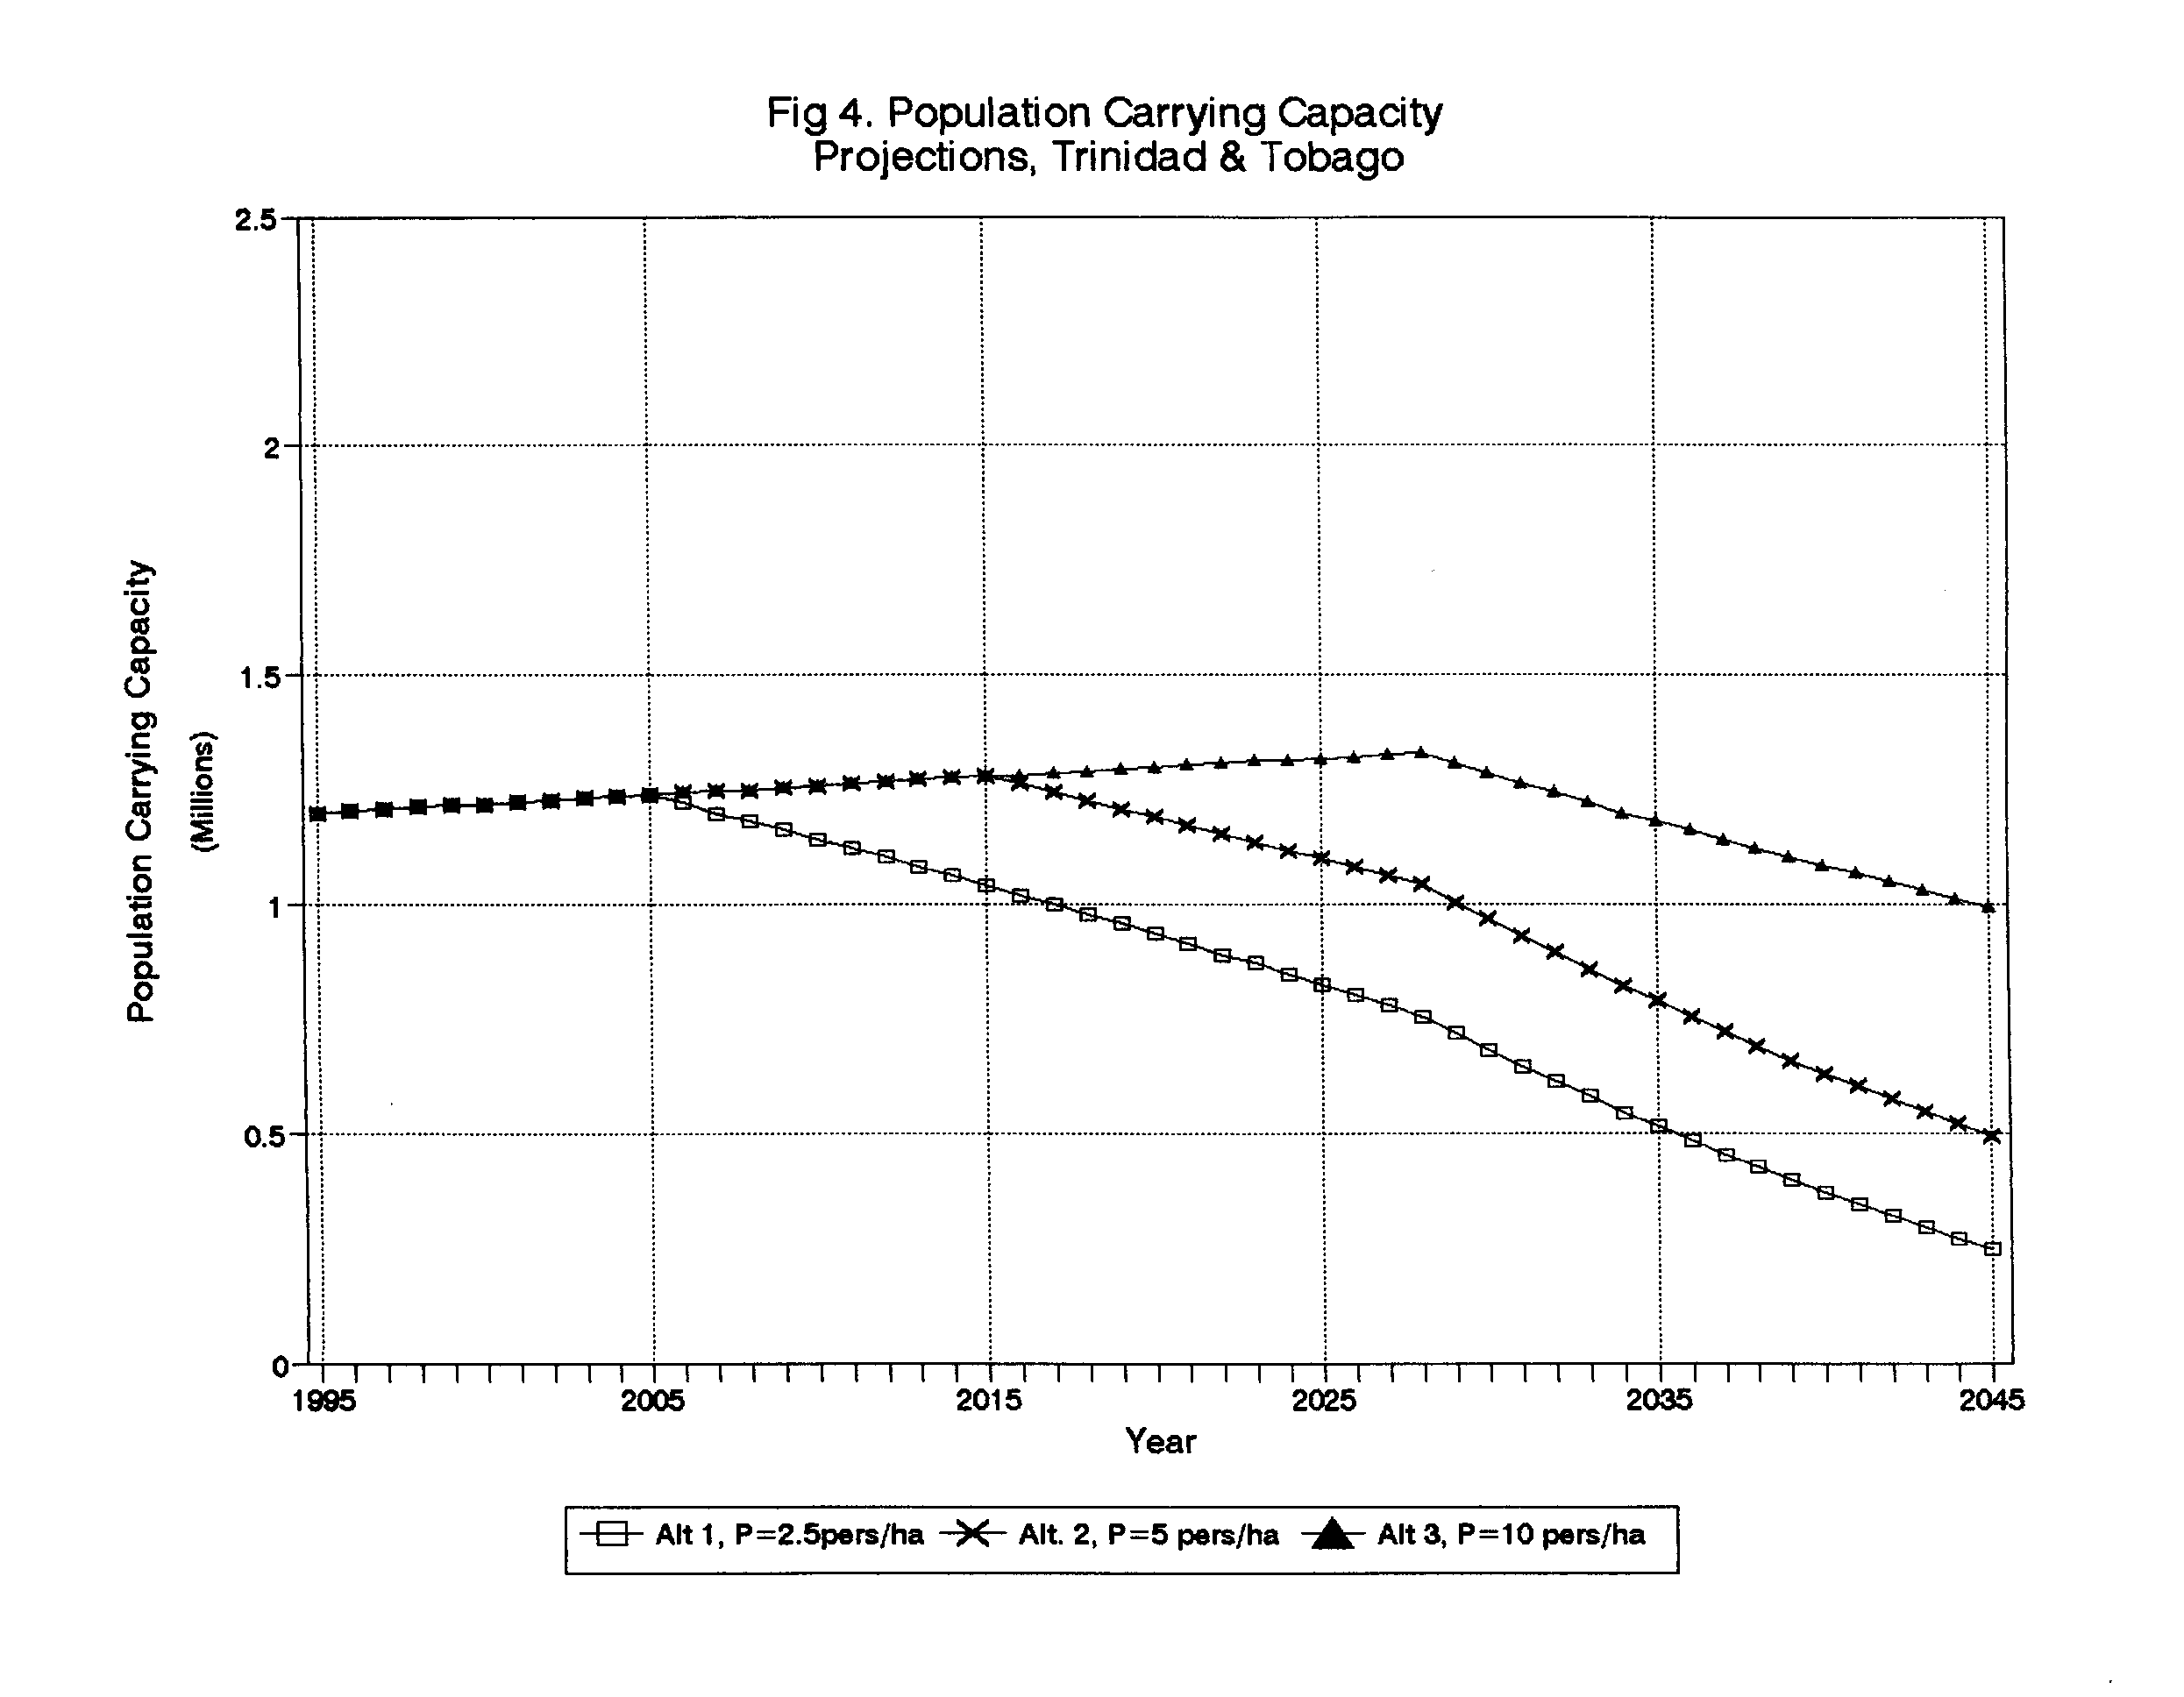
Because of the uncertainty over both the magnitude and the timing of the decline in maximal arable-land productivity, three different cases will be considered. The three assumptions correspond to different "paths" (curves) from the current maximal arable-land productivity to the eventual arable-land productivity. Specifically, it will be assumed that maximal productivity continues at a level of 10 persons per hectare for 10 years, for 20 years, and for 30 years, before declining to a lower level. Furthermore, three levels will be assumed for the lower level: 10 persons per hectare (i.e., no change), 5 persons per hectare, and 2.5 persons per hectare. Although the assumption of an eventual level of 10 persons per hectare is not considered reasonable, it is nevertheless included to show that the general conclusions reached in this analysis are not dependent on the particular productivity level assumed. (Note: The conclusions of this report are not affected by the assumed level of productivity in 50 years; in all cases, the gap between population and population carrying capacity is large and continues to widen.)
Figure 4 shows the projections of population carrying capacity under the preceding assumptions about the availability of arable land and the productivity of the land. In the Figure, "Alternative 1" refers to the assumption of constant productivity at a level of 10 persons per hectare for 10 years followed by a decline to 2.5 persons per hectare in 2045; "Alternative 2" refers to the assumption of constant productivity at 10 persons per hectare for 20 years followed by a decline to 5 persons per hectare in 2045; and "Alternative 3" refers to the assumption of constant productivity of 10 persons per hectare throughout the period 1995-2045.

V. Projection of Population
Historical Population of Trinidad and Tobago
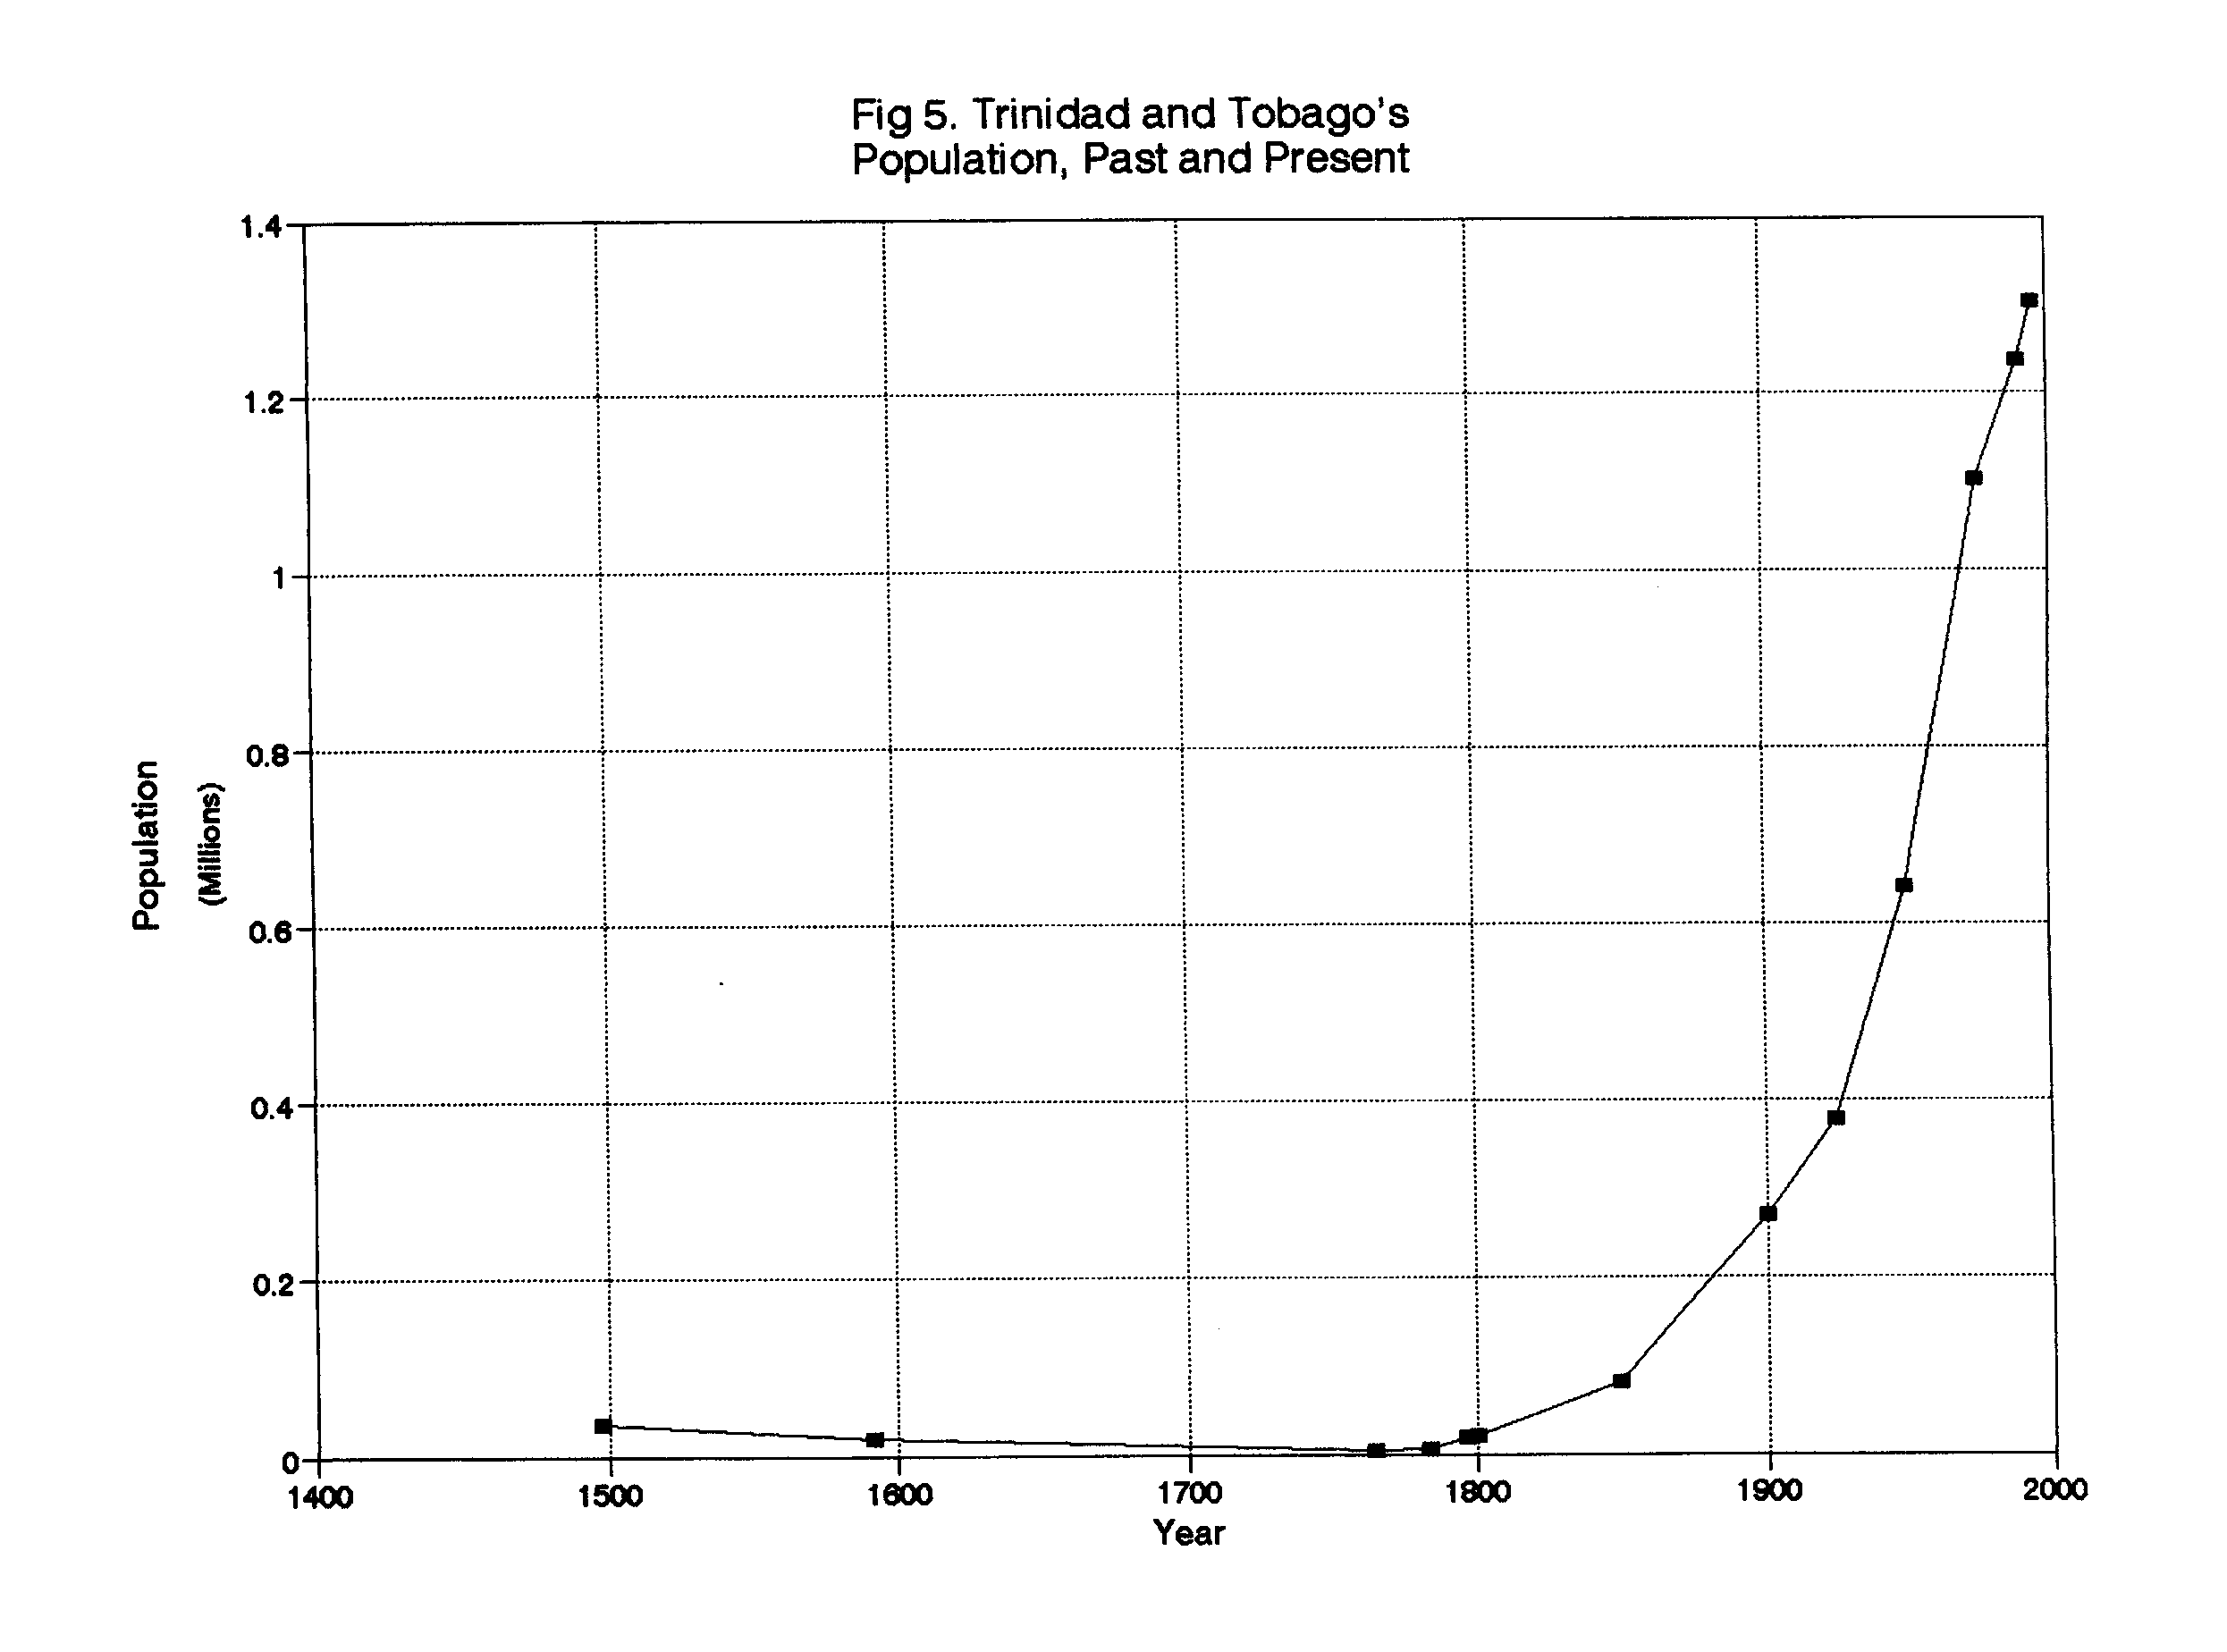
Figure 5 shows the historical population of Trinidad and Tobago. The Figure graphically illustrates the explosive population growth of the nation in recent times, with the population growth in the past 50 years is approximately equal to the growth in all preceding history.
Exponential growth of the type that has continued in Trinidad and Tobago for the past several decades cannot continue indefinitely. At current growth rates, Trinidad and Tobago's population is doubling in less than fifty years. At the rate at which the island nation's land resources are being consumed, the growth will cease before long. The nation's response to the situation will determine whether the cessation of growth is orderly or catastrophic, and whether it occurs before or after the natural environment is completely destroyed.
The data in Figure 5 are from several sources. The early historical data are from Bridget Brereton's book, A History of Modern Trinidad, 1783-1962 (Reference 7), and most of the later historical data are from the Atlas of World Population History (Reference 8). The most recent data are from United Nations or related sources.
The following table presents the data plotted in Figure 5.
Year Population Source
1498 20,000-40,000 Brereton (Ref. 7)
1592 15,000-20,000 Brereton
1765 2,503 Brereton
1784 6,503 Brereton
1797 17,718 Brereton
1800 20,000 Atlas of World Population History (Ref. 8)
1850 80,000 Atlas of World Population History
1900 270,000 Atlas of World Population History
1925 380,000 Atlas of World Population History
1950 630,000 Atlas of World Population History
1950* 640,000 World Resources Institute (Ref. 4)
1975 1,100,000 Atlas of World Population History
1990 1,240,000 World Resources Institute
1990* 1,236,000 The Population Council (Ref. 3)
1992 1,300,000 The World Bank (Ref. 1)
1995 1,310,000 World Resources Institute
1995* 1,305,000 The Population Council
For the cases in which multiple figures are available, the asterisked ones are plotted in Figure 5. These figures were selected because they are of highest precision (greatest number of significant digits).
Population Projections -- No Resource Constraints
Population projections for Trinidad and Tobago are available from several sources, including the World Bank (Reference 1) and United Nations (References 2, 3, and 4). These projections are made under assumptions about the demographic characteristics of the population in the future. The most important assumption concerns the total fertility rate (TFR), or average total number of children that a cohort of women will have during their lifetime. It is the expected number of births that 1,000 women would have if they experienced a particular set of age-specific birth rates throughout their reproductive span (equal to the average number of children born to a women in her lifetime in a stable population). It is usually specified on a per-woman basis, e.g., 2.7 children per woman.
Most population projections are based on very simple assumptions about future total fertility rates and the values of other demographic parameters, such as the assumption that the TFR will decline steadily to a "replacement" level (value of about 2.1 for healthy populations) and stay at that value thereafter.
The following table presents several population projections for Trinidad and Tobago, under this assumption. Standard World Bank and United Nations (UN) sources present projections to the year 2025; Appendix A generates a projection to the year 2045. The projections specified below for the period 1995-2025 are from the United Nations Population Division, reported by the World Resources Institute (Reference 4).
2000* 1,365,000 The Population Council
2000 1,000,000 The World Bank (rounded to nearest million)
2025* 1,780,000 World Resources Institute
2025 1,800,000 United Nations Population Fund (Ref. 2)
2025 2,000,000 The World Bank (rounded to nearest million)
2045* 2,006,000 Appendix A of this report
In the figures that follow, the asterisked figures will be plotted, because they are of similar precision (they are all based on similar demographic assumptions).
Each of the preceding population projections is based on a single assumption about the values of all demographic parameters that affect population growth. Because of the uncertainty associated with assumptions about the future values of demographic parameters, however, it is usual to make projections under a range of values of key parameters. The UN, for example, publishes three global population projections -- the high, medium, and low "variants". The populations given above correspond to the low variant.
Population projections are quite sensitive to the assumptions made about future demographic parameter values, especially total fertility rates and migration rates. Seemingly small changes in the values of these parameters can result in quite sizable differences in the projection after a few years. Because of the high level of sensitivity of population projections to the assumed values of the demographic parameters, it is desirable to perform a "sensitivity analysis," in which projections are made under a range of values for the most important parameters.
Appendix A presents population projections for Trinidad and Tobago under three different sets of assumptions about the values of demographic parameters affecting population growth (fertility rates, mortality rates, and migration rates). For an island nation such as Trinidad, a factor that is every bit as important as the TFR is the emigration rate. The three population projections for Trinidad and Tobago correspond to alternative assumptions about the TFR and the emigration rate. The following table summarizes these assumptions (additional details are provided in Appendix A).
Total
Projection/ Fertility Emigration
Assumption Set Rate (TFR) Rate
I 2.5-2.4 10,000/year
II 2.5-2.3 5,000/year
III 2.5-2.1 0/year
The third projection listed above (TFR declining to 2.1, zero emigration) corresponds most closely to the UN "low variant" projection. The other two projections assume that a substantial emigration occurs. If little emigration occurs and the TFR does not decline rapidly to 2.1, the projected population would be substantially larger than the highest projection listed above (i.e., Projection III). Such projections would correspond more closely to the UN medium and high variant cases. (Note: Emigration can keep the rate of growth substantially less than the natural rate of increase. As the global population expands rapidly in the coming years, immigration may be a major factor in determining a particular country's population. Since immigration has a net value of zero for the world, it is not a factor in projections of the global population. For this reason, although much study has been conducted by international organizations on total fertility rate, its determinants, and its trends, relatively little attention has been paid to immigration. For Trinidad and Tobago, however, immigration can be (as evidenced by the nation's history) as important a factor as total fertility rate. The preceding assumption sets consider three rather arbitrarily specified levels of emigration for Trinidad and Tobago. Because of its substantial impact on the nation's population, the topic of immigration warrants further study.)
Figure 6 displays these three population projections.

Appendix A presents a rationale for selecting the preceding values as a basis for the projections. The projections resulting from the three sets of values presented above are not the highest nor the lowest projections that could be obtained by assuming various combinations of reasonable values for the key parameters, but they do indicate a range in which population projections are likely to fall under reasonable assumptions. The projections presented in Figure 6 are not "best estimates" of population and carrying capacity, since they simply extrapolate current trends without taking into full and detailed account the interrelationships among the variables. For the purposes of this report, a rough idea of the likely range of future population is all that is needed.
Population projections invariably provoke argument, because of their inherent uncertainty and simplicity, and because of the importance of the stakes involved in the issues involved. It is important that such arguments center on a discussion of the assumptions under which the projections are made, not simply on a blind acceptance or rejection of the projection per se. If a projection is not accepted as reasonable, reasons should be presented concerning which demographic values are not believed, and other values suggested (with a rationale).
The purpose of using population projections is to assist planning. They are widely used in social and economic planning and policy analysis because so many social and economic variables are related to population. The principal advantages of population projections are their relative simplicity and ease of generation. They are very useful for obtaining "first-cut" assessments of future situations, and of the potential long-run implications of alternative behavior, actions, or policies. This report makes use of population projections to assess the relationship between Trinidad and Tobago's population and its ability to feed itself, if current trends continue.
About the only thing that can be said with certainty about the future is that it will not follow any prespecified course. A single projection is not very useful, since it does not indicate a range of uncertainty, such as a statistical confidence interval or tolerance interval. A set of projections under a range of parameter values deemed reasonable by a group of informed individuals is much more credible and therefore useful as a basis for planning. The three-projection population-projection set of Figure 6 is presented as a candidate set for preliminary planning purposes; other projections may readily be added to the Figure, as they become available.
As was discussed earlier, it is helpful to display population projections as part of a graph showing population growth over a long period of time. Figure 7 displays the population of Trinidad and Tobago, including both the historical data shown in Figure 5 and the third projection listed above (TFR=2.1, emigration =0 persons/year).
Population Projections with Resource Constraints
Although simple projections such as those above are useful for short-term planning, they are of limited value for long-range planning because they do not explicitly take into account the relationship of population growth to other variables, such as economic developments or resource constraints. Because population growth "explodes" (grows exponentially) for any positive growth rate (TFR above the replacement level), published projections assume that the TFR declines to that level. Total fertility rate is not, however, the ultimate determinant of population size. These projections ignore the various constraints that can moderate population growth, such as land availability, land productivity, water availability, climate, politics, and economics.
Even if it is assumed that the total fertility rate declines to replacement level, population projections for most countries rise to extremely high levels because of the "momentum" of population growth (i.e., the increase in the birth rate caused when the large number of children had by a previous high-fertility-rate generation enters their reproductive years). In the case of Trinidad and Tobago, for example, the population will continue to grow to over two million persons by the year 2045 even if it is assumed that the TFR quickly declines to 2.1.
Simple population projections do not take into account the effects of other factors, such as economic and resource constraints, that can have a substantial effect on population growth. Because fossil fuels are being rapidly depleted, it is difficult to imagine how many nations will be able to afford, in the long run, either the energy inputs to maintain agricultural production at current yield levels, or to import food to cover large food deficits. It is no longer expected that additional breakthroughs will occur in agriculture to significantly increase yields, as in the past. In the long run, the population of countries whose populations far exceed the carrying capacity of their own arable land will be subject to population decreases from famine, migration, war, disease, or other external forces. All of these factors have operated in the past, and they will occur with greater frequency in the future as global population soars and fossil-fuel supplies exhaust.
Figure 8 combines two of the figures presented earlier -- it shows the population projections (Figure 6) and the carrying-capacity projections (Figure 4) on the same graph. This figure illustrates the growth of the gap between population and carrying capacity, under the trend projections discussed earlier (i.e., on the assumptions about future values of demographic, economic, and resource-utilization trends). The salient feature of Figure 8 is that there is a substantial gap between the projected carrying capacity of the arable-land resources of the nation and the projected population, a gap which widens with each passing year. The graph clearly shows an ever-widening gap between population and carrying capacity even under the assumption that productivity continues unchanged (Alternative 3).

Figure 9 shows a population projection that takes into account the expected decline in carrying capacity. The Figure shows the approximate points in time at which the population of Trinidad and Tobago passed the points at which it was self-sufficient in food based on low-energy-input agriculture (ca. 1950) and based on high-energy-input agriculture (ca. 1990). These dates represent fundamental changes in the vulnerability of the nation's population. They may be referred to as Phase I (food-self-sufficient with the low energy inputs of traditional agriculture), Phase II (food-self-sufficient with high-energy-input agriculture and low-trophic-level consumption), and Phase III (unable to provide sufficient food for population from nation's own agricultural resources: dependent on exports, migration, or other factors to provide food or reduce population). Trinidad and Tobago is in the unenviable position of having recently entered Phase III.
The projection of Figure 9 assumes that the population of Trinidad and Tobago changes to match the carrying capacity of the arable land over the period 2025-2045, assuming that the amount of arable land remains constant at 1,200 km2 and the arable-land productivity decreases to 5 persons per hectare by the year 2045. At that level, the nation's arable-land resources can support a total of 5 x 1,200 x 100 = 600,000 people (at a low trophic level of consumption). The reasonableness of the precipitousness of the drop might be questioned, but it is consistent with the behavior of populations that exceed the carrying capacity of their environment. As noted in Reference 13, the failure of populations to level off at or just below the carrying capacity is a result of the momentum of exponential growth. Once a population begins to grow, it tends to continue growing, causing it to overshoot its carrying capacity.
The environmental factor that has enabled mankind to reach a very high population level is fossil fuels. Once mankind began to tap this large, one-time energy windfall, the global population began to grow, starting from about half a billion people in 1650. Once fossil fuels are depleted, high-energy-input agriculture and its associated high levels of productivity will cease and the human population will decrease to pre-fossil-fuel levels (about half a billion for the planet, about half a million for Trinidad and Tobago). Whether the human population of Trinidad and Tobago will actually soar to 1.8 million or 2 million or 2.5 million people before ultimately collapsing is anybody's guess. Two things, however, are patently clear: (1) the world and Trinidadian supply of oil and natural gas is rapidly being depleted; and (2) without massive energy inputs, agricultural productivity is far below current levels. Whether the size of the human population adjusts to match the total food supply is not an issue -- it will; whether the adjustment is planned and orderly or unplanned and catastrophic is mankind's choice.
VI. Environmental Situation Assessment
From an environmental perspective, one must assess what the impact on the environment will be under the various population projections. If it is assumed that population growth continues indefinitely, the natural environment simply ceases to exist. If energy prices rise so that the gap between the nation's population and its ability to produce its own food increases, the pressure on the land will also become severe.
Population projections for Trinidad and Tobago do not paint a rosy picture for the environment. Political leaders and environmental planners must decide whether they will simply preside over the ultimate demise of the nation's natural environment, or take bold steps to avert impending disaster. The projections presented in this report are simply extensions of current trends that are obvious when graphically displayed. Population is exploding. Natural forest areas are rapidly being deforested. Global energy reserves are quickly being depleted. Trinidad and Tobago's own energy reserves are also being depleted. If an environmental disaster is to be averted, changes must be made in these trends. The challenge to environmental planning and management over the next several years will be to identify and implement a strategy that will stop the current trends, and protect and preserve the environment for Trinidad and Tobago's current and future generations.
References
1. World Development Report 1994, Published for the World Bank by Oxford University Press, New York, 1994
2. The State of World Population 1994, United Nations Population Fund, New York, 1994
3. Ross, John A., W. Parker. Mauldin, and Vincent. C. Miller, Family Planning and Population: A Compendium of International Statistics, The Population Council, New York, 1993
4. World Resources 1994-95, World Resources Institute, Oxford University Press, New York, 1994
5. Hammond Explorer Atlas of the World, Hammond Incorporated, Maplewood, NJ, 1993
6. The State of Food and Agriculture 1989, Food and Agriculture Organization of the United Nations, available from UNIPUB, New York, 1989
7. Brereton, Bridget, A History of Modern Trinidad: 1783-1962, Heinemann Educational Books (Caribbean) Ltd, Port of Spain, Trinidad, 1981
8. McEvedy, Colin and Richard Jones, Atlas of World Population History, Facts on File, New York, published by Penguin Books and Allen Lane, 1978
9. Morgan, Michael D., Joseph M. Moran, and James H. Wiersma, Environmental Science: Managing Biological & Physical Resources, Wm. C. Brown Publishers, Dubuque, IA, 1993
10. Keyfitz, Nathan and Wilhelm Flieger, World Population: An Analysis of Vital Data, University of Chicago Press, Chicago, 1968
11. Coale, Ansley J. and Paul Demeny with Barbara Vaughn, Regional Model Life Tables and Stable Populations, 2nd edition, Academic Press, New York, 1983
12. Caldwell, J. G., DESTINY Planning and Forecasting System, Module 1: Single-Country Programs, User's Manual Version 1.0, Spartanburg, SC, 1995
Appendix A. Population Projections for Trinidad and Tobago
This appendix describes the demographic data used in the population projections presented in the text. Figures A1-A3 present the data used for the three projections presented in the text.
Base-Year Demographic Data
Data on current and recent-past birth rates, death rates, and total fertility rates were readily available from United Nations Sources (References 1-4). Data on the age-sex distribution ("population pyramid") of the population for the base year (1995) were not readily available. Such data are available from public health offices in Trinidad, but time did not permit obtaining these data.
Reference 4 presented age distributions for Trinidad and Tobago for 1975 and 1995, but for only three age categories:
Age 1975 1995
<15 38.0 33.8
15-65 57.0 60.5
>65 4.9 5.7
Detailed age-sex distribution of the population of Trinidad and Tobago were available from Reference 10 (Keyfitz and Flieger, World Population: An Analysis of Vital Data) for 1961, with projections for 1965, 1970, and 1975, but these were considered too old, in view of the substantial changes in fertility and mortality that have occurred in recent years.
Rather than use the old data, it was decided to select a stable population from Reference 11 (Coale and Demeny, Regional Model Life Tables and Stable Populations) for the base year age-sex distribution data. The stable population selected was the "West" population for mortality level 24 and a gross reproduction rate of 1.75 for mean age of the underlying maternity schedule equal to 29 years. The population in the age categories of that table match those specified above quite well, as shown below:
Age Female Male
<15 32.36 33.05
15-65 58.96 60.97
>65 8.66 5.98
The selected Coale-Demeny table has a female life expectancy of 77.5 years and a male life expectancy of 73.9 years; female birth rate of 25.06 and male birth rate of 25.73; and female death rate of 6.00 and male death rate of 6.67. The growth rate of these tables, 1.9% does not match current levels for Trinidad and Tobago (about 1%), but this is probably accounted for by emigration (zero for the stable population, and probably several thousand per year for Trinidad and Tobago).
The following table specifies the percentage of males and females in each age category of the selected Coale-Demeny stable-population tables. The variable TOTPOP is the total base-year population. FEMRADIX is the radix of the female table, and MALRADIX is the radix of the male table. AGE specifies the age category. FEMPROP specifies the percentage of females in each age category, and MALPROP specifies the percentage of males in each age category. FEMPOP is the number of females in each age category, obtained by multiplying FEMPROP times TOTPOP. MALPOP is similarly defined. (Note: For input to the computer programs used to make the population projections, the first two age categories were combined, as were the last five.)
TOTPOP FEMRADIX MALRADIX AGE FEMPROP MALPROP FEMPOP MALPOP
1305000 7750000 7390508 0 ‑1 2.46 2.52 16433 16053
1‑ 4 9.38 9.58 62658 61025
5 ‑9 10.75 10.98 71809 69943
10‑14 9.77 9.97 65263 63510
15‑19 8.87 9.05 59251 57649
20‑24 8.06 8.20 53840 52235
25‑29 7.31 7.43 48830 47330
30‑34 6.63 6.73 44288 42871
35‑39 6.01 6.10 40146 38857
40‑44 5.44 5.51 36339 35099
45‑49 4.91 4.95 32798 31532
50‑54 4.40 4.41 29392 28092
55‑59 3.91 3.87 26119 24652
60‑64 3.42 3.30 22845 21021
65‑69 2.91 2.71 19439 17263
70‑74 2.34 2.07 15631 13186
75‑79 1.69 1.40 11289 8918
80‑84 1.05 0.80 7014 5096
85‑89 0.50 0.34 3340 2166
90‑94 0.15 0.09 1002 573
95+ 0.02 0.01 134 64
No data were available for immigration. Based on the difference between the Coale-Demeny stable population growth rate and the recent growth rate, emigration might be comparable to half of current growth (.01 x 1,305,000 = 13,050), or about 6,500 per year.
Projected Demographic Data
Total Fertility Rates Figure A4 presents a plot of total fertility rates of Trinidad and Tobago and other Latin American nations for the period 1980-90 (Trinidad and Tobago is labeled as "TRIN"). The values of TFR for Trinidad and Tobago for recent years are as follows (Reference 3):
Year TFR
1960-65 5.0
1975-80 3.4
1980-85 3.2
1985-90 3.0
1990-95 2.7
1995-2000 2.5
Extrapolation of the values for 1985-90 (3.0 and 2.7) suggest that TFR might decline to a value of 2.4 for the period 1995-2000.
Beyond that period, as discussed in the text, it is assumed that the TFR in later periods either remains constant at 2.4 (Projection I), declines to 2.3 (Projection II) or declines to 2.1 (Projection III).
Emigration Rates/Numbers Since no data were available on emigration, a wide range of values was assumed for this parameter. Comparison of the current total population growth rate to the growth rate of the Coale-Demeny stable population suggests an emigration rate of about 6,500. Emigration values of 10,000, 5,000, and 0 emigrants per year were used for Projections I, II, and III, respectively.
Fertility Age Distributions No data were available for the fertility age distribution. The fertility age distribution for the US 1980 "other races" population was used as a surrogate (Source: Statistical Abstract 1981). This same distribution was used for all future years.
Infant Mortality Rates Assumed to continue at current level of 15 per 1,000 live births.
The population projections were made using the cohort-component method, using the computer programs of Reference 12. For each year of the projection, this program selects the Coale-Demeny "West" model life table corresponding to the specified infant mortality rate.
Figure A1. Demographic Data for Projection I
DESTINY (R) PLANNING AND FORECASTING COMPUTER PROGRAM PACKAGE, VERSION 1.0
PROGRAM NAME: CHECK
DATE OF RUN (DD/MM/YYYY): 9/17/1995
TIME OF RUN (HH:MM:SS): 7:15:17
NAME OF PARAMETER FILE = TRIN951.DAT
GENERAL POPULATION DESCRIPTION:
TRINIDAD & TOBAGO RESIDENT POPULATION (FERT. RATE=2.4, EMIG. RATE=10,000/YR)
BASE YEAR = 1995
NO OF RACIAL/ETHNIC GROUPS = 1
NO OF REGIONS = 0
VITAL STATISTICS PARAMETER OPTION = 2
LIFE TABLE OPTION = 1
EXTERNAL MIGRATION OPTION = 1
INTERNAL MIGRATION OPTION = 0
SERVICE SYSTEM OPTION = 0
NAME(S) OF RACE ...
ALL
PARAMETERS FOR RACE = ALL
TOTAL FERTILITY RATE(S)...
2.500 2.400 2.400 2.400 2.400 2.400 2.400 2.400 2.400 2.400
FERTILITY AGE DISTRIBUTION(S)...
.221 .312 .251 .143 .058 .015
.221 .312 .251 .143 .058 .015
.221 .312 .251 .143 .058 .015
.221 .312 .251 .143 .058 .015
.221 .312 .251 .143 .058 .015
.221 .312 .251 .143 .058 .015
.221 .312 .251 .143 .058 .015
.221 .312 .251 .143 .058 .015
.221 .312 .251 .143 .058 .015
.221 .312 .251 .143 .058 .015
INFANT MORTALITY RATE(S)...
15.00 15.00 15.00 15.00 15.00 15.00 15.00 15.00 15.00 15.00
EXPECTATION OF LIFE AT BIRTH CORRESPONDING TO IMR FOR FIRST
PROJECTION PERIOD = 73.89
BASE‑YEAR POPULATION AND SURVIVAL PROBABILITIES FOR FIRST PROJECTION PERIOD...
MALE FEMALE MALE FEMALE
0 .9790 .9849
0‑4 77078. 79091. .9967 .9977
5‑9 69943. 71809. .9981 .9988
10‑14 63510. 65263. .9974 .9986
15‑19 57649. 59251. .9959 .9979
20‑24 52235. 53840. .9953 .9972
25‑29 47330. 48830. .9950 .9965
30‑34 42871. 44288. .9939 .9954
35‑39 38857. 40146. .9912 .9933
40‑44 35099. 36339. .9856 .9893
45‑49 31523. 32798. .9755 .9828
50‑54 28092. 29392. .9584 .9729
55‑59 24652. 26119. .9317 .9564
60‑64 21021. 22845. .8909 .9261
65‑69 17263. 19439. .8277 .8722
70‑74 13186. 15631. .7353 .7851
75+ 16817. 22779. .4885 .5270
TOTAL 637126. 667860.
TOTAL BASE‑YEAR POPULATION (POPBASE) = 1304986.
CRUDE BIRTH RATE FOR BASE YEAR = 23.30
CRUDE DEATH RATE FOR BASE YEAR = 6.30
INFANT MORTALITY RATE FOR BASE YEAR = 15.00
POPULATION (POPPREV) TEN YEARS PRIOR TO BASE YEAR = 1191000.
AVERAGE CRUDE BIRTH RATE FOR PREVIOUS TEN YEARS = 24.65
AVERAGE CRUDE DEATH RATE FOR PREVIOUS TEN YEARS = 6.45
AVERAGE INFANT MORTALITY RATE FOR PREVIOUS TEN YEARS = 20.00
ANNUAL EXTERNAL MIGRATION RATE(S) (PER 1000) (EMRATE)...
.000
ANNUAL EXTERNAL MIGRATION NUMBER(S) (IMMNO)...
‑10000.
TOTAL FERTILITY RATE (TFREST) ESTIMATED FROM BASE‑YEAR BIRTH RATE = 2.960
TOTAL FERTILITY RATE (TFR) SPECIFIED FOR FIRST PROJECTION PERIOD = 2.500
GENERAL FERTILITY RATE (BIRTH RATE (BRFF) PER 1000 FEMALES AGED 15‑44)
FOR BASE YEAR = 107.56
ESTIMATE OF ANNUAL NET EXTERNAL MIGRATION NUMBER (BASED ON BIRTH RATE
AND DEATH RATE FOR PREVIOUS TEN YEARS) = ‑11180.
ESTIMATED ANNUAL RATE PER 1000 = ‑9.018
ANNUAL NET MIGRATION NUMBER SPECIFIED FOR FIRST PROJECTION PERIOD = ‑10000.
ANNUAL NET MIGRATION RATE PER 1000 SPECIFIED FOR FIRST PROJECTION
PERIOD = .000
ANNUAL NET MIGRATION (MIG) IMPLIED BY MIGRATION NUMBER (IMMNO) AND/OR
MIGRATION RATE (EMRATE) SPECIFIED FOR FIRST PROJECTION PERIOD = ‑10000.
APPROX ANNUAL RATE PER 1000 POPULATION (MIGR) = ‑7.663
CRUDE BIRTH RATE PER 1000 (CBR) FOR FIRST PROJECTION PERIOD = 18.097
CRUDE DEATH RATE PER 1000 (CDR) FOR FIRST PROJECTION PERIOD = 7.475
AVERAGE ANNUAL POPULATION GROWTH RATE PER 1000 FOR PREVIOUS TEN YEARS
= 1000((POPBASE/POPPREV(IR))**.1‑1) = 9.18
PROJECTED POPULATION GROWTH RATE (GIVEN SPECIFIED PARAMETERS):
1000((POPPROJ/POPBASE)**.2‑1) = 3.71
APPROX. ANNUAL POPULATION GROWTH RATE PER 1000, BASED ON CBR,
CDR, AND MIGR = CBR‑CDR+MIGR = 2.96
Figure A2. Demographic Data for Projection II
DESTINY (R) PLANNING AND FORECASTING COMPUTER PROGRAM PACKAGE, VERSION 1.0
PROGRAM NAME: CHECK
DATE OF RUN (DD/MM/YYYY): 9/17/1995
TIME OF RUN (HH:MM:SS): 7:15:49
NAME OF PARAMETER FILE = TRIN951.DA2
GENERAL POPULATION DESCRIPTION:
TRINIDAD & TOBAGO RESIDENT POPULATION (FERT. RATE=2.3, EMIG. RATE=5,000/YR)
BASE YEAR = 1995
NO OF RACIAL/ETHNIC GROUPS = 1
NO OF REGIONS = 0
VITAL STATISTICS PARAMETER OPTION = 2
LIFE TABLE OPTION = 1
EXTERNAL MIGRATION OPTION = 1
INTERNAL MIGRATION OPTION = 0
SERVICE SYSTEM OPTION = 0
NAME(S) OF RACE ...
ALL
PARAMETERS FOR RACE = ALL
TOTAL FERTILITY RATE(S)...
2.500 2.300 2.300 2.300 2.300 2.300 2.300 2.300 2.300 2.300
FERTILITY AGE DISTRIBUTION(S)...
.221 .312 .251 .143 .058 .015
.221 .312 .251 .143 .058 .015
.221 .312 .251 .143 .058 .015
.221 .312 .251 .143 .058 .015
.221 .312 .251 .143 .058 .015
.221 .312 .251 .143 .058 .015
.221 .312 .251 .143 .058 .015
.221 .312 .251 .143 .058 .015
.221 .312 .251 .143 .058 .015
.221 .312 .251 .143 .058 .015
INFANT MORTALITY RATE(S)...
15.00 15.00 15.00 15.00 15.00 15.00 15.00 15.00 15.00 15.00
EXPECTATION OF LIFE AT BIRTH CORRESPONDING TO IMR FOR FIRST
PROJECTION PERIOD = 73.89
BASE‑YEAR POPULATION AND SURVIVAL PROBABILITIES FOR FIRST PROJECTION PERIOD...
MALE FEMALE MALE FEMALE
0 .9790 .9849
0‑4 77078. 79091. .9967 .9977
5‑9 69943. 71809. .9981 .9988
10‑14 63510. 65263. .9974 .9986
15‑19 57649. 59251. .9959 .9979
20‑24 52235. 53840. .9953 .9972
25‑29 47330. 48830. .9950 .9965
30‑34 42871. 44288. .9939 .9954
35‑39 38857. 40146. .9912 .9933
40‑44 35099. 36339. .9856 .9893
45‑49 31523. 32798. .9755 .9828
50‑54 28092. 29392. .9584 .9729
55‑59 24652. 26119. .9317 .9564
60‑64 21021. 22845. .8909 .9261
65‑69 17263. 19439. .8277 .8722
70‑74 13186. 15631. .7353 .7851
75+ 16817. 22779. .4885 .5270
TOTAL 637126. 667860.
TOTAL BASE‑YEAR POPULATION (POPBASE) = 1304986.
CRUDE BIRTH RATE FOR BASE YEAR = 23.30
CRUDE DEATH RATE FOR BASE YEAR = 6.30
INFANT MORTALITY RATE FOR BASE YEAR = 15.00
POPULATION (POPPREV) TEN YEARS PRIOR TO BASE YEAR = 1191000.
AVERAGE CRUDE BIRTH RATE FOR PREVIOUS TEN YEARS = 24.65
AVERAGE CRUDE DEATH RATE FOR PREVIOUS TEN YEARS = 6.45
AVERAGE INFANT MORTALITY RATE FOR PREVIOUS TEN YEARS = 20.00
ANNUAL EXTERNAL MIGRATION RATE(S) (PER 1000) (EMRATE)...
.000
ANNUAL EXTERNAL MIGRATION NUMBER(S) (IMMNO)...
‑5000.
TOTAL FERTILITY RATE (TFREST) ESTIMATED FROM BASE‑YEAR BIRTH RATE = 2.960
TOTAL FERTILITY RATE (TFR) SPECIFIED FOR FIRST PROJECTION PERIOD = 2.500
GENERAL FERTILITY RATE (BIRTH RATE (BRFF) PER 1000 FEMALES AGED 15‑44)
FOR BASE YEAR = 107.56
ESTIMATE OF ANNUAL NET EXTERNAL MIGRATION NUMBER (BASED ON BIRTH RATE
AND DEATH RATE FOR PREVIOUS TEN YEARS) = ‑11180.
ESTIMATED ANNUAL RATE PER 1000 = ‑9.018
ANNUAL NET MIGRATION NUMBER SPECIFIED FOR FIRST PROJECTION PERIOD = ‑5000.
ANNUAL NET MIGRATION RATE PER 1000 SPECIFIED FOR FIRST PROJECTION
PERIOD = .000
ANNUAL NET MIGRATION (MIG) IMPLIED BY MIGRATION NUMBER (IMMNO) AND/OR
MIGRATION RATE (EMRATE) SPECIFIED FOR FIRST PROJECTION PERIOD = ‑5000.
APPROX ANNUAL RATE PER 1000 POPULATION (MIGR) = ‑3.831
CRUDE BIRTH RATE PER 1000 (CBR) FOR FIRST PROJECTION PERIOD = 18.097
CRUDE DEATH RATE PER 1000 (CDR) FOR FIRST PROJECTION PERIOD = 7.475
AVERAGE ANNUAL POPULATION GROWTH RATE PER 1000 FOR PREVIOUS TEN YEARS
= 1000((POPBASE/POPPREV(IR))**.1‑1) = 9.18
PROJECTED POPULATION GROWTH RATE (GIVEN SPECIFIED PARAMETERS):
1000((POPPROJ/POPBASE)**.2‑1) = 7.46
APPROX. ANNUAL POPULATION GROWTH RATE PER 1000, BASED ON CBR,
CDR, AND MIGR = CBR‑CDR+MIGR = 6.79
Figure A3. Demographic Data for Projection III
DESTINY (R) PLANNING AND FORECASTING COMPUTER PROGRAM PACKAGE, VERSION 1.0
PROGRAM NAME: CHECK
DATE OF RUN (DD/MM/YYYY): 9/17/1995
TIME OF RUN (HH:MM:SS): 7:16: 9
NAME OF PARAMETER FILE = TRIN951.DA3
GENERAL POPULATION DESCRIPTION:
TRINIDAD & TOBAGO RESIDENT POPULATION (FERT. RATE=2.1, EMIG. RATE=0/YR)
BASE YEAR = 1995
NO OF RACIAL/ETHNIC GROUPS = 1
NO OF REGIONS = 0
VITAL STATISTICS PARAMETER OPTION = 2
LIFE TABLE OPTION = 1
EXTERNAL MIGRATION OPTION = 1
INTERNAL MIGRATION OPTION = 0
SERVICE SYSTEM OPTION = 0
NAME(S) OF RACE ...
ALL
PARAMETERS FOR RACE = ALL
TOTAL FERTILITY RATE(S)...
2.500 2.300 2.100 2.100 2.100 2.100 2.100 2.100 2.100 2.100
FERTILITY AGE DISTRIBUTION(S)...
.221 .312 .251 .143 .058 .015
.221 .312 .251 .143 .058 .015
.221 .312 .251 .143 .058 .015
.221 .312 .251 .143 .058 .015
.221 .312 .251 .143 .058 .015
.221 .312 .251 .143 .058 .015
.221 .312 .251 .143 .058 .015
.221 .312 .251 .143 .058 .015
.221 .312 .251 .143 .058 .015
.221 .312 .251 .143 .058 .015
INFANT MORTALITY RATE(S)...
15.00 15.00 15.00 15.00 15.00 15.00 15.00 15.00 15.00 15.00
EXPECTATION OF LIFE AT BIRTH CORRESPONDING TO IMR FOR FIRST
PROJECTION PERIOD = 73.89
BASE‑YEAR POPULATION AND SURVIVAL PROBABILITIES FOR FIRST PROJECTION PERIOD...
MALE FEMALE MALE FEMALE
0 .9790 .9849
0‑4 77078. 79091. .9967 .9977
5‑9 69943. 71809. .9981 .9988
10‑14 63510. 65263. .9974 .9986
15‑19 57649. 59251. .9959 .9979
20‑24 52235. 53840. .9953 .9972
25‑29 47330. 48830. .9950 .9965
30‑34 42871. 44288. .9939 .9954
35‑39 38857. 40146. .9912 .9933
40‑44 35099. 36339. .9856 .9893
45‑49 31523. 32798. .9755 .9828
50‑54 28092. 29392. .9584 .9729
55‑59 24652. 26119. .9317 .9564
60‑64 21021. 22845. .8909 .9261
65‑69 17263. 19439. .8277 .8722
70‑74 13186. 15631. .7353 .7851
75+ 16817. 22779. .4885 .5270
TOTAL 637126. 667860.
TOTAL BASE‑YEAR POPULATION (POPBASE) = 1304986.
CRUDE BIRTH RATE FOR BASE YEAR = 23.30
CRUDE DEATH RATE FOR BASE YEAR = 6.30
INFANT MORTALITY RATE FOR BASE YEAR = 15.00
POPULATION (POPPREV) TEN YEARS PRIOR TO BASE YEAR = 1191000.
AVERAGE CRUDE BIRTH RATE FOR PREVIOUS TEN YEARS = 24.65
AVERAGE CRUDE DEATH RATE FOR PREVIOUS TEN YEARS = 6.45
AVERAGE INFANT MORTALITY RATE FOR PREVIOUS TEN YEARS = 20.00
ANNUAL EXTERNAL MIGRATION RATE(S) (PER 1000) (EMRATE)...
.000
ANNUAL EXTERNAL MIGRATION NUMBER(S) (IMMNO)...
0.
TOTAL FERTILITY RATE (TFREST) ESTIMATED FROM BASE‑YEAR BIRTH RATE = 2.960
TOTAL FERTILITY RATE (TFR) SPECIFIED FOR FIRST PROJECTION PERIOD = 2.500
GENERAL FERTILITY RATE (BIRTH RATE (BRFF) PER 1000 FEMALES AGED 15‑44)
FOR BASE YEAR = 107.56
ESTIMATE OF ANNUAL NET EXTERNAL MIGRATION NUMBER (BASED ON BIRTH RATE
AND DEATH RATE FOR PREVIOUS TEN YEARS) = ‑11180.
ESTIMATED ANNUAL RATE PER 1000 = ‑9.018
ANNUAL NET MIGRATION NUMBER SPECIFIED FOR FIRST PROJECTION PERIOD = 0.
ANNUAL NET MIGRATION RATE PER 1000 SPECIFIED FOR FIRST PROJECTION
PERIOD = .000
ANNUAL NET MIGRATION (MIG) IMPLIED BY MIGRATION NUMBER (IMMNO) AND/OR
MIGRATION RATE (EMRATE) SPECIFIED FOR FIRST PROJECTION PERIOD = 0.
APPROX ANNUAL RATE PER 1000 POPULATION (MIGR) = .000
CRUDE BIRTH RATE PER 1000 (CBR) FOR FIRST PROJECTION PERIOD = 18.097
CRUDE DEATH RATE PER 1000 (CDR) FOR FIRST PROJECTION PERIOD = 7.475
AVERAGE ANNUAL POPULATION GROWTH RATE PER 1000 FOR PREVIOUS TEN YEARS
= 1000((POPBASE/POPPREV(IR))**.1‑1) = 9.18
PROJECTED POPULATION GROWTH RATE (GIVEN SPECIFIED PARAMETERS):
1000((POPPROJ/POPBASE)**.2‑1) = 11.15
APPROX. ANNUAL POPULATION GROWTH RATE PER 1000, BASED ON CBR,
CDR, AND MIGR = CBR‑CDR+MIGR = 10.62
![]()
Appendix B. Projection Data Base
Figure B1. Projection Data Base
YEAR POP1 POP2 POP3 AREATOT AREAARA AREAFOR PALDENS1 PALDENS2 PALDENS3 CARRY1 CARRY2 CARRY3
1995 1304986 1304986 1304986 5128 1200 1350 10.00 10.00 10.00 1200000 1200000 1200000
1996 1312280 1317280 1322280 5128 1204 1310 10.00 10.00 10.00 1204000 1204000 1204000
1997 1319573 1329573 1339573 5128 1208 1270 10.00 10.00 10.00 1208000 1208000 1208000
1998 1326867 1341867 1356867 5128 1212 1230 10.00 10.00 10.00 1212000 1212000 1212000
1999 1334160 1354161 1374161 5128 1216 1190 10.00 10.00 10.00 1216000 1216000 1216000
2000 1341454 1366454 1391454 5128 1220 1150 10.00 10.00 10.00 1220000 1220000 1220000
2001 1348847 1378029 1408332 5128 1224 1110 10.00 10.00 10.00 1224000 1224000 1224000
2002 1356241 1389604 1425211 5128 1228 1070 10.00 10.00 10.00 1228000 1228000 1228000
2003 1363634 1401179 1442089 5128 1232 1030 10.00 10.00 10.00 1232000 1232000 1232000
2004 1371027 1412754 1458967 5128 1236 990 10.00 10.00 10.00 1236000 1236000 1236000
2005 1378420 1424329 1475845 5128 1240 950 10.00 10.00 10.00 1240000 1240000 1240000
2006 1387008 1437380 1491992 5128 1244 910 9.81 10.00 10.00 1220675 1244000 1244000
2007 1395595 1450431 1508139 5128 1248 870 9.63 10.00 10.00 1201200 1248000 1248000
2008 1404182 1463483 1524286 5128 1252 830 9.44 10.00 10.00 1181575 1252000 1252000
2009 1412770 1476534 1540432 5128 1256 790 9.25 10.00 10.00 1161800 1256000 1256000
2010 1421357 1489585 1556579 5128 1260 750 9.06 10.00 10.00 1141875 1260000 1260000
2011 1430180 1503181 1573462 5128 1264 710 8.88 10.00 10.00 1121800 1264000 1264000
2012 1439002 1516776 1590344 5128 1268 670 8.69 10.00 10.00 1101575 1268000 1268000
2013 1447825 1530372 1607226 5128 1272 630 8.50 10.00 10.00 1081200 1272000 1272000
2014 1456648 1543967 1624109 5128 1276 590 8.31 10.00 10.00 1060675 1276000 1276000
2015 1465470 1557562 1640992 5128 1280 550 8.13 10.00 10.00 1040000 1280000 1280000
2016 1473060 1570063 1657005 5128 1284 510 7.94 9.83 10.00 1019175 1262600 1284000
2017 1480650 1582564 1673017 5128 1288 470 7.75 9.67 10.00 998200 1245067 1288000
2018 1488240 1595065 1689031 5128 1292 430 7.56 9.50 10.00 977075 1227400 1292000
2019 1495830 1607566 1705044 5128 1296 390 7.38 9.33 10.00 955800 1209600 1296000
2020 1503420 1620067 1721057 5128 1300 350 7.19 9.17 10.00 934375 1191667 1300000
2021 1509491 1630933 1735332 5128 1304 310 7.00 9.00 10.00 912800 1173600 1304000
2022 1515561 1641801 1749607 5128 1308 270 6.81 8.83 10.00 891075 1155400 1308000
2023 1521631 1652667 1763883 5128 1312 230 6.63 8.67 10.00 869200 1137067 1312000
2024 1527701 1663535 1778158 5128 1316 190 6.44 8.50 10.00 847175 1118600 1316000
2025 1533771 1674401 1792434 5128 1320 150 6.25 8.33 10.00 825000 1100000 1320000
2026 1538891 1684154 1805016 5128 1324 110 6.06 8.17 10.00 802675 1081267 1324000
2027 1544012 1693907 1817599 5128 1328 70 5.88 8.00 10.00 780200 1062400 1328000
2028 1549132 1703660 1830181 5128 1332 30 5.69 7.83 10.00 757575 1043400 1332000
2029 1554253 1713413 1842763 5128 1309 0 5.50 7.67 10.00 720146 1003840 1309356
2030 1559373 1723166 1855346 5128 1287 0 5.31 7.50 10.00 683770 965323 1287097
2031 1563976 1732316 1866651 5128 1265 0 5.13 7.33 10.00 648423 927825 1265216
2032 1568580 1741466 1877957 5128 1244 0 4.94 7.17 10.00 614081 891324 1243708
2033 1573183 1750617 1889262 5128 1223 0 4.75 7.00 10.00 580718 855795 1222565
2034 1577786 1759767 1900568 5128 1202 0 4.56 6.83 10.00 548313 821217 1201781
2035 1582389 1768917 1911874 5128 1181 0 4.38 6.67 10.00 516841 787567 1181351
2036 1586381 1777407 1922000 5128 1161 0 4.19 6.50 10.00 486281 754824 1161268
2037 1590373 1785897 1932127 5128 1142 0 4.00 6.33 10.00 456610 722967 1141526
2038 1594365 1794387 1942254 5128 1122 0 3.81 6.17 10.00 427808 691974 1122120
2039 1598357 1802877 1952380 5128 1103 0 3.63 6.00 10.00 399854 661827 1103044
2040 1602349 1811367 1962507 5128 1084 0 3.44 5.83 10.00 372726 632504 1084292
2041 1605432 1818836 1971190 5128 1066 0 3.25 5.67 10.00 346404 603987 1065859
2042 1608516 1826304 1979874 5128 1048 0 3.06 5.50 10.00 320870 576257 1047740
2043 1611599 1833773 1988557 5128 1030 0 2.88 5.33 10.00 296104 549295 1029928
2044 1614682 1841242 1997240 5128 1012 0 2.69 5.17 10.00 272088 523083 1012420
2045 1617765 1848711 2005923 5128 995 0 2.50 5.00 10.00 248802 497604 995208
Appendix C. Statistical Summary for Trinidad and Tobago
Data Sources: References 1-4 (primarily Ref. 4, World Resources 1994)
1990 1995
Land Area 5,128 km2 5,128 km2
Population 1.24m 1.31m
Arable Land 1,200 km2
Forested Land 1,550 km2
Population Growth Rate 1.03
Crude Birth Rate 23.3/1,000 population
Crude Death Rate 6/1,000 population
Life Expectancy at Birth 71.3 years
Total Fertility Rate 2.7/woman
Infant Mortality Rate 18/1,000 live births
Under-five Mortality Rate 24/1,000 per 1,000 live births
Maternal Mortality Rate 110/100,000 live births
Population Density 2.49/ha
Domesticated Land as % of Land Area 26%
Cropland 1,200 km2
Hectares per capita .10
Permanent Pasture 110 km2
Forest and Woodland 2,200 km2
Urban Population as % of Total 66.6%
Persons per Vehicle 1
Percent Unemployment, male 16%
Percent Unemployment, female 23%
Index of Agricultural Production (1980=100) 103 total, 89 per capita
Index of Food Production (1980=100) 105 total, 91 per capita
Average Production of Cereals 17,000 metric tons
Average Yields of Cereals 2,833 kg/ha
Percent Change since 1980 -9%
Average Yields of Roots and Tubers 11,000 kg/ha
Percent Change since 1980 14%
Irrigated Land as % of Cropland 18%
Avg. Annual Fertilizer Use 67kg/ha of cropland
Pesticide Consumption 2,303 metric tons
Tractors 2,623
% Change since 1980 11
Average Annual Net Trade in Food
Cereals 254,000 metric tons (import)
Food Oils 14,618 metric tons
Avg. Annual Donations or Receipts of Food Aid 0
Agricultural Labor Force 7% of total labor force
Natural Forest 1,550 km2
Annual Deforestation Total Forest
Extent 40 km2
Percent 1.9%
Annual Logging of Closed Broadleaf Forest
Extent 30 km2
As % of Closed Forest 1.8%
% That Is Primary Forest 4%
Plantations
Extent 180 km2
Total Forest
Extent 1,550 km2
% Annual Change, 1981-90 -1.9%
Forest Ecosystem Type
Rain
Extent 1,550 km2
% Annual Change -1.9%
Roundwood Production
Total 75,000 m3
% Change since 1980 -12%
Fuel and Charcoal 22,000 m3
% Change since 1980 38%
Industial Roundwood 53,000 m3
% Change since 1980 -24%
Processed Wood Production
Sawnwood 62,000 m3
% Change since 1980 90%
Average Annual Net Trade in Roundwood 2,000 m3
Commercial Energy Production
Total 533 petajoules (PJ)
% Change since 1971 -2%
Solid 0
Liquid 312 PJ
% Change since 1971 -24%
Gas 221 PJ
% Change since 1971 64%
Commercial Energy Consumption
Total 296 PJ
% Change since 1971 169%
Per capita 237 gigajoules (GJ)
% Change since 1971 111%
Per constant $US of GNP 72 megajoules (MJ)
% Change since 1971 161%
Imports as a % of Consumption -76% (-137% in 1971)
Traditional Fuels
Total 3 PJ
% Change since 1971 -51%
Per Capita 2,249 MJ
% Change since 1971 -62%
Percentage of Total Consumption 1% (7% in 1971)
Crude Oil (proved recoverable reserves) 80 million metric tons
Natural Gas (proved recoverable reserves) 252 billion cubic meters)
Gross Domestic Product US$5,388 in 1992
Distribution of GDP:
Agriculture 3%
Industry 36%
Manufacturing 8%
Services 61%
Annual Internal Renewable Water Resources
Total 5.10 km3
Per Capita 4,030 m3
Annual Withdrawals
Total .15 km3 (1975)
% of Water Resources 3%
Per Capita 148 m3
Sectoral Withdrawals
Domestic 27%
Industry 38%
Agriculture 35%
Average Annual Marine Catch
Total 8,420 metric tons
% Change since 1980 109%
Per Capita Annual Food Supply from Fish and
Seafood
Total 7.4 kg
% Change since 1980 -42.1%
Carbon Dioxide Emmisions
Total 18,430,000 metric tons
Solid 0
Liquid 5,884,000 metric tons
Gas 10,845,000 metric tons
Gas Flaring 1,479,000 metric tons
Cement Manufacture 219,000 metric tons
Per Capita Carbon Dioxide Emissions 14.73 metric tons
Carbon Dioxide Emissions from Land-Use Change 1,100,000 metric tons
Methane from Antropogenic Sources
Total 98,000 metric tons
Solid Waste 7,000 metric tons
Coal Mining 0
Oil and Gas Production 87,000 metric tons
Wet Rice Agriculture 1,000 metric tons
Livestock 3,000 metric tons
Chlorfluorocarbons 0
FndID(241)
FndTitle(ENVIRONMENTAL SITUATION ASSESSMENT: TRINIDAD AND TOBAGO)
FndDescription(An application of the DESTINY demographic forecasting and analysis system to perform an environmental situation assessment of Trinidad and Tobago.)
FndKeywords(DESTINY; Trinidad and Tobago; environmental situation assessment; demographic analysis; population projection; synthetic estimation)