It’s the Oil, Stupid! (Hubbert’s Curve and World War III)
Copyright © 2003 Joseph George Caldwell. All rights reserved. Posted at Internet website http://www.foundationwebsite.org . May be copied or reposted for non-commercial use, with attribution to author and website. (27 August 2003, updated 16 September 2003, 8 November 2003, graphics scale corrected 22 February 2004, Table 2 scale corrected 13 May 2004)
Contents
Added Note (14 September 2003) 20
Introduction and Summary
I never cease to be amazed how much time and effort are going into trying to show that US President George W. Bush and British Prime Minister Tony Blair used subterfuge to justify the invasion of Iraq. The US and Britain invaded Iraq because the world is running out of oil, and it was considered extremely important for the very large reserves in Iraq to be under Anglo-American control in the declining years of the petroleum age. Most Americans and many Britons are unaware that global oil production is about to peak, and they are unaware that this event signals the end of the industrial age and of their high standard of living. But the populations of both nations share a high sense of moral propriety, and it would have been unseemly to state simply that we were invading Iraq to gain unimpeded access to Iraqi oil. If this had been acknowledged as the true (main) reason for the invasion, it have flown in the face of the US’ and Britain’s ostensible moral principles and not have been approved by the US and British populations. For this reason, both leaders made a strong case that we were invading Iraq to further higher ideals – to fight terrorism, to eliminate weapons of mass destruction, and to free the Iraqi people from the strict dictatorship of Saddam Hussein. With these high-minded principles accepted as the basis for invading Iraq, the US and British populations approved the war. Some people knew that the real reason for the invasion was to ensure Anglo-American control of Iraqi oil, but most of them kept silent, knowing that political realities dictated that other reasons should be represented as the reasons for the invasion.
So, I would suggest to the American and British people that, for their continued peace of mind, they discontinue the inquiry into the real reasons for the Iraqi invasion. George Bush and Tony Blair did it for you, and they did not admit to the true reason for the invasion so that you would not feel uncomfortable about proceeding with it, even though it was essential to maintaining your high standard of living for a little while longer. As the petroleum age draws to an end, America and Britain will take whatever steps are necessary to gain access to the declining global oil reserves. In the years to come, there will be more invasions like that of Iraq. At some point, it will be obvious to everyone that the reason for these invasions – these resource wars – is oil. But it will always, and certainly initially, be easier to justify them when they are wrapped in the swaddling cloth of national defence (fighting terrorism, eliminating weapons of mass destruction) and liberty (freeing people from dictators, establishing democracy, promoting free trade). By placing Iraqi oil under Anglo-American control, the US and Britain ensure that Iraqi oil will be available to the US and to Britain, rather than to China (and India, and Russia, and any other country you wish to mention). From the viewpoint of prolonging the high Anglo-American standard of living for a few years more, the invasion of Iraq was absolutely necessary. George Bush and Tony Blair did a fine job of accomplishing the invasion of Iraq without requiring Americans and Britons to feel bad about doing so. They have read their Machiavelli well. They told white lies not just to rally strong emotional support for the invasion, but also so that Americans and Britons could continue to live at a high standard of living – and in a fairyland of high-minded principles – for a little while longer.
This article will summarize why the invasion of Iraq was considered essential to protecting American and British interests in continuing industrial activity at a high level in the US and Britain.
Hubbert’s Curve
Dr. Marion King Hubbert was a geologist who, in 1949, presented a curve predicting the rise and fall of oil production in the conterminous United States. After the passage of time, this curve proved to be quite accurate, and it came to be known as “Hubbert’s curve.” It is a “bell-shaped” curve, which rises to a single peak (highest point) and then declines. The peak is known as “Hubbert’s peak.” According to Hubbert’s curve, oil production in a large area increases very fast initially, when much oil is discovered and is easy to extract. Then, when approximately half of the total oil reserve has been extracted, production tapers off and then declines as less and less new oil is discovered, extraction becomes more difficult and costly, and the initial wells run out. (This life-cycle of the oil production process is sometimes referred to as “Hubbert’s cycle.”) Production of a well or field ends when it ceases to be profitable. Since oil is used mainly as a source of energy (as opposed to a raw material for other products), production ceases, independently of economic considerations (specifically, no how high the price rises), when the amount of (high grade commercial) energy required to extract the oil exceeds the amount of energy produced by the oil.
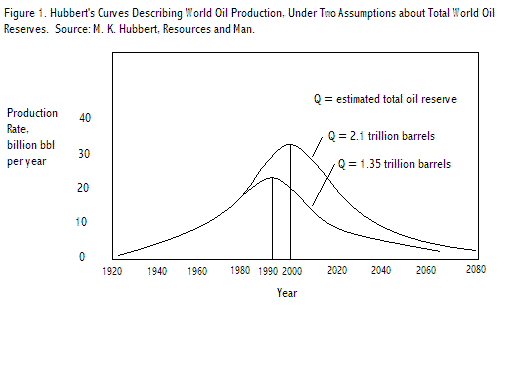
Following the success of Hubbert’s curve in predicting the year of peak production in the United States, Hubbert’s methodology (with slight modification over the years) has been used to predict the rise and fall of global oil production. Figure 1 illustrates two different versions of Hubbert’s curve for global oil production. The two curves differ with respect to the estimate of the total global reserves. For one curve, the estimated total global oil reserve is 1.35 trillion barrels (bbl), and for the other, it is 2.1 trillion bbl (the current, widely accepted estimate). The very interesting thing to note about the peak on Hubbert’s curve is that it does not shift very much, even if the estimate of total global reserves changes substantially. In the example in Figure 1, for example, when the estimate of total global reserves almost doubled, from 1.35 trillion bbl to 2.1 trillion bbl, the peak of the curve shifted only ten years, from 1990 to 2000. This is true for the following reasons. First, when the first oil wells are opened in a large oil-bearing region, the “energy return” of the oil is very high – one barrel of oil can be used to produce many others. Also, in the initial years of exploration of a large oil-bearing region, much oil is found. Since oil is so bountiful initially, it is inexpensive, and, since it is so very useful, demand (consumption) rises very fast – “exponentially” (or “geometrically”), in mathematical terms. In any finite system, however, exponential growth never lasts very long, and the time soon arrives when the exponential growth ceases – discoveries become less frequent and smaller in size, the oil in older wells becomes more difficult to extract, and the early wells start to exhaust. From a “mathematical” viewpoint, the total oil reserve is the area under the curve (the sum, or integral, of all of the yearly production amounts). The area under an exponential curve (the early phase of production) grows exponentially, however, and so very little change in the distance from the start of the curve to the peak corresponds to a very large change in the area under the curve. In other words, the total reserve may vary considerably and yet the time of the peak (from the initial year of production) hardly changes. For those who say that we might discover some more massive oil reserves, and that this would extend the duration of the petroleum age, this means that such finds will not change the date of the end of the petroleum age at all. The petroleum age will end by 2050, period.
It should be recognized that Hubbert’s curve reflects economic, political, physical and technological phenomena at work. Without the influence of economics (demand), of course, no exploration for oil would take place and no production facilities would be developed, and no oil would be pumped at all. As we are keenly aware, political influences can certainly restrict production (e.g., the OPEC cartel, the Kuwait war). And the state of our knowledge of engineering and science (physics / geology / technology) determines how successful we are in locating new reserves and places restrictions on just how fast oil can be extracted from an oil field. In the early years of exploitation (i.e., of “Hubbert’s cycle”), it is possible to produce more oil than is demanded, and economics and politics may stimulate or retard discovery, development and production to a considerable extent. Technological considerations (rates of discovery, extraction technology) may place general limits on just how fast production increases, but supply and demand are kept in balance mainly by political or economic considerations (price adjustments, production restrictions). In the later years, demand far outstrips supply, and discovery and production are pressed to the limit. Near the end of the cycle, production is constrained by the facts that few producing fields remain and that oil can be extracted from the ground just so fast. At this point, economic considerations have little effect on the rate of production (i.e., the supply (production) is “inelastic” with respect to the price).
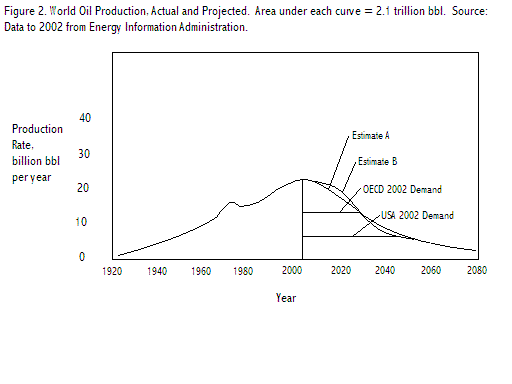
It is noted that, as time passes and more data become available, Hubbert’s curve, which is an estimate of future production, is revised. Figure 1 displayed “early” versions of Hubbert’s curve, based on the initial years of global oil production. Figure 2 shows “later” versions of Hubbert’s curve, where actual production figures are used through the year 2000. Current wisdom is that the total global reserve of oil (that already pumped plus that still in the ground) is 2.1 trillion bbl, that about half of the oil had been pumped out by the year 2000, and that the peak in global oil production will occur sometime in the 2001-2010 decade. Some geologists believe that the peak may occur this year (2003), many believe that it will occur by 2010, and a few believe that it might even occur later than 2010. In any event, almost all agree that the peak will occur within the next few years.
Recall that the area under the Hubbert’s curve (which shows annual production over the entire life cycle of a region) is the total global reserve. Since it is estimated that half of the world’s oil was been extracted by 2000, half of the area under the curves of Figure 2 occurs up to the year 2000, and half of the area occurs after 2000.
It should be recognized that the main reason that production peaks and then declines rapidly is because of the exponential increase in production in the early years of exploitation. Because oil is so very useful and so very inexpensive, demand is high, and it continues to stimulate exploration, development, and production at an exponential (“compound growth”) rate. At some point, however, global production starts to decline, and there is very little that can be done to prevent the decline. It is simply not possible to extract oil from the declining number of old oil fields at a faster and faster rate, to keep up with demand. It is not possible to maintain production at a fixed level until all of the oil is gone. Once the point is reached at which supply starts to decline, production falls faster and faster each year. The fundamental reason underlying Hubbert’s peak is the fact that extraction of the oil continues to grow at an exponential rate until all of the “easy” oil (easy to find and inexpensive to extract) is gone. After that point is reached, only the “difficult” oil (hard to find and expensive to extract) remains – and the situation becomes bleaker with each passing year. The initial growth in production is “explosive,” and explosions never last very long.
It is emphasized that the oil does not simply “run out” all of a sudden. Global production simply becomes less and less, as the last few wells are exhausted (i.e., become commercially unprofitable, or have a “net energy” return near zero). If we arbitrarily mark the “end” of the petroleum age as a point in time where production is a particular (small) fraction of peak production, then the end of the petroleum age occurs at about the same time, no matter how extraordinary are the efforts made to find new fields. This is partly due to the fact that as time passes the geology of the planet becomes very well known, so there is simply no region that has not been thoroughly explored. No significant new oil fields are discovered, and the existing wells exhaust. A second reason is that, once production peaks, demand exceeds supply by a growing – and soon large – amount. Because of this, as the final oil discoveries occur, those fields are exploited as fast as possible – there is no attempt to “stretch out” the duration of production. Each new field discovered after the peak is passed is exploited as quickly as possible.
Hubbert’s curve for the United States was somewhat symmetrical, i.e., the decline in oil production after the peak rather mirrored the rise in production before the peak. For the global Hubbert’s curve, it is expected that the “peak” region may be a little “flatter,” and that the decline will occur somewhat more rapidly than the rise. The reason for this is that, as US production declined, oil companies simply expended more and more effort in exploring for oil and exploiting new fields abroad (since it was more profitable – more fields to discover, and a high energy return as they go into production), with no real incentive to try to press US exploration or production to extreme levels. For the global situation, however, there is no other region to explore or exploit, and so, as production falls below demand, the price rises, and the pressure mounts to explore every possible area and pump all remaining wells at the fastest rate possible. This situation is somewhat different from the situation that prevailed in the US, and it is expected that it will result in a global Hubbert’s curve that has a slightly flatter peak region, followed by a somewhat steeper decline in production, than the US Hubbert’s curve exhibits. Refer to Figure 2. It is quite possible that we have already passed the “halfway” point of Hubbert’s curve (i.e., the point at which half of the total reserve has been extracted), and are now consuming the second half of the total reserve, even if the peak year has not been reached. In fact, it is more that “quite possible.” In view of the fact that we have long passed the initial exponential-growth part of the curve, it is very likely.
A large amount of research has gone into the analysis of Hubbert’s curve. A recent book on the subject is Kenneth S. Deffeyes’ Hubbert’s Peak: The Impending World Oil Shortage (Princeton University Press, 2001). An article in the popular press is “The End of Cheap Oil?” by Colin J. Campbell and Jean Laherrère, Scientific American, March 1998.
What Will Happen Now?
Since the dawn of the petroleum age, the world has known nothing but growth in energy production, in industrial production, and in human population. That is about to change. The competition for the shrinking production will become intense. As has been discussed in numerous books and articles (e.g., Michael Klare’s Resource Wars: The New Landscape of Global Conflicts (Metropolitan, 2001) or Thomas F. Homer-Dixon’s Economics, Scarcity and Violence (Princeton University Press, 2001)), human beings do not simply sit around and collectively starve to death. They go to war. Initially, there may well be alliances, such as, to invoke the imagery of Samuel Huntington and Robert Kaplan, “The West” against “The Rest.” Eventually, it may well be that anarchy prevails, with every nation for itself – although, as long as a single global superpower exists, the anarchy will reign in those countries without oil. Hubbert’s curve offers some insight into what will happen, and shows how desperate the situation will become, and how quickly things will change. In the following, we consider two possible scenarios.
In the discussion that follows, reference will be made to production, consumption (“demand”), and reserve amounts of various countries or country groupings. Tables 1-3 present statistics on these quantities, for the year 2002, for a number of the world’s countries. These statistics were taken from tables posted at the US Energy Information Administration Internet website, at http://www.eia.doe.gov/emeu/international/petroleu.html .Table 1 presents consumption (“demand”) figures for the countries that use the most oil; Table 2 presents production figures for the leading producing countries; and Table 3 presents reserve estimates for the countries having the largest estimated reserves. Note that Table 3 refers to “known” reserves, which total 1.032 trillion barrels of oil. In addition to these known reserves, it is estimated that an additional 724 million barrels of oil and 5.2 billion cubic feet of gas, and 215 million barrels of natural gas liquids will be discovered (Source: World Assessment Summaries by US Geological Survey World Energy Assessment Team, from Energy Information Administration). The total known reserves, 1.032 trillion barrels, plus the undiscovered reserves, .721 trillion barrels of oil and .215 trillion barrels of natural gas liquids, is the total estimated global reserves, 1.968 trillion barrels of oil.
|
Table 1. World Oil Demand, 2002 (million barrels per day). Source: Energy Information Administration, Table 2.4. |
|
|
United States |
19.76 |
|
Canada |
2.1 |
|
Mexico |
1.98 |
|
Australia & New Zealand |
1.02 |
|
Japan |
5.3 |
|
Korea, South |
2.18 |
|
France |
1.98 |
|
Germany |
2.72 |
|
Italy |
1.85 |
|
UK |
1.70 |
|
Other OECD Europe |
6.82 |
|
Total OECD (incl. above 11 items) |
47.69 |
|
Former USSR |
3.93 |
|
China |
5.26 |
|
Other Asia |
7.69 |
|
Total Non-OECD (incl. above 3 items) |
29.87 |
|
Total World Demand |
77.56 |
|
Table 2. World Production of Crude Oil, Natural Gas Plant Liquids, and Other Liquids, 2001 (million barrels per day). Source: Energy Information Administration, Table G1. |
|
|
Saudi Arabia |
8.711 |
|
United States |
8.054 |
|
Russia |
7.286 |
|
Iran |
3.804 |
|
Mexico |
3.590 |
|
Norway |
3.408 |
|
China |
3.300 |
|
Venezuela |
3.080 |
|
Canada |
2.738 |
|
United Arab Emirates |
2.566 |
|
United Kingdom |
2.541 |
|
Iraq |
2.452 |
|
Nigeria |
2.256 |
|
Kuwait |
2.117 |
|
Brazil |
1.561 |
|
Algeria |
1.520 |
|
Indonesia |
1.451 |
|
Libya |
1.429 |
|
Oman |
0.964 |
|
Qatar |
0.864 |
|
Argentina |
0.829 |
|
Egypt |
0.817 |
|
Kazakhstan |
0.798 |
|
Angola |
0.742 |
|
India |
0.732 |
|
Australia |
0.731 |
|
World Total (incl. all above) |
75.461 |
|
Table 3. World Crude Oil and Natural Gas Reserves, January 1, 2002 (billion barrels). Source: Energy Information Administration, Table 8.1 (from Oil and Gas Journal) |
|
|
Saudi Arabia |
261.8 |
|
Iraq |
112.5 |
|
United Arab Emirates |
97.8 |
|
Kuwait |
96.5 |
|
Iran |
89.7 |
|
Venezuela |
77.7 |
|
Russia |
48.6 |
|
Libya |
29.5 |
|
Mexico |
26.9 |
|
China |
24.0 |
|
Nigeria |
24.0 |
|
United States |
22.4 |
|
Qatar |
15.2 |
|
Norway |
9.4 |
|
Algeria |
9.2 |
|
Brazil |
8.5 |
|
Oman |
5.5 |
|
Kazakhstan |
5.4 |
|
Angola |
5.4 |
|
Indonesia |
5.0 |
|
United Kingdom |
4.9 |
|
Canada |
4.9 |
|
India |
4.8 |
|
Yemen |
4.0 |
|
Australia |
3.5 |
|
Malaysia |
3.0 |
|
Argentina |
3.0 |
|
Egypt |
2.9 |
|
Syria |
2.5 |
|
Gabon |
2.5 |
|
Ecuador |
2.1 |
|
Colombia |
1.8 |
|
Congo (Brazzaville) |
1.5 |
|
Brunei |
1.4 |
|
Azerbaijan |
1.2 |
|
Denmark |
1.1 |
|
Romania |
1.0 |
|
Other |
10.9 |
|
World Total |
1,032.0 |
The West against The Rest
Table 1 presents a listing of the demand for oil for a number of the world’s countries. Let us arbitrarily call the OECD (Organization for Economic Cooperation and Development) countries “The West,” and the remaining countries “The Rest.” The OECD countries, which are the world’s industrially developed nations, account for 47.69 million barrels per day out of 77.56 million barrels per day, or 61.48 percent, of global demand. (Note that up to the present time, consumption could be used as a surrogate, or “proxy,” for demand, since production (“supply”) could be increased, and would be adjusted to demand by means of price adjustments – this will no longer be the case, however, once Hubbert’s peak is passed, when production will no longer be sensitive to price increases and consumption will fall far below demand.)
Once Hubbert’s peak is passed and global production starts to fall, it may be expected that global war will not break out immediately. Instead, powerful countries will require that production be sent to them, and that countries too small to protest simply be cut off. Because of the “politics of envy,” the “have nots” will launch increasingly frequent and destructive acts of terrorism to destroy oil fields, pipelines, refineries, storage facilities and oil tankers. Figure 2 shows what will eventually happen, if supply is not seriously interrupted. It is expected that, initially, despite falling world production, consumption will not decline much in the OECD countries. Much of our infrastructure is very dependent on oil, and conservation measures cannot accomplish very much to decrease demand / consumption. There is no satisfactory substitute for oil, not simply because it has a high energy content and is easily transported, but mainly because of its vastness – no other energy source is available to replace it. Since much of the US’ increasing demand has been because of immigration (mass immigration, causing growth of population and of energy consumption of about one percent per year), the US may finally take steps to curb immigration. But apart from that, there is really little that can be done, without causing serious negative economic effects. The US and other OECD countries are all in a fix.
Since the OECD countries are essentially in charge of the world, they will, for a while, be able to continue to keep their consumption at high levels, at the expense of non-OECD nations. Figure 2 shows what would happen if OECD nations continue their consumption at high levels at the expense of other nations. By about the year 2030, their consumption, if it continues at the present level, would equal the total world production. By that point, push would have come to shove, and resource wars would have erupted among the world’s powerful (industrial, OECD) nations. These will be very destructive wars, since it will be known that only by destroying the enemy’s industrial production capacity – or its population – will demand for oil be lessened (and increasing the global supply will no longer be an option).
The US against the Rest
Since the US is the world’s sole remaining superpower, it is in a position to keep much of the world production to itself, for a while. And it is very highly motivated to do so. As President Bush once declared, “The US lifestyle is not negotiable!” Figure 2 shows what would happen if the US maintains its consumption at the 2003 levels (19.76 million barrels per day, or 25.47 percent, of current global production) as long as it can, i.e., until global production falls to that level. Figure 2 shows that by about the year 2040, the US would be consuming the total world production. At that point, the US would be in competition with all of the world’s nations for all of the remaining oil.
So what can be done? Well, as global production falls, there are basically two approaches to securing sufficient oil. One is to expropriate the production amounts that were previously being used by other nations. The other is to reduce consumption. But how is this possible? Well, it is very difficult to decrease the per-capita consumption, so about the only way to decrease consumption is by decreasing the population. Now, decreasing the population of other countries will have little or no effect on the US demand for (consumption of) oil – the only way to decrease US consumption is to reduce the US population. And the only feasible way to accomplish this is by means of war.
Ever since the Immigration Act of 1965, the US has been allowing many more immigrants into the country than ever before. As long as oil was abundant and free (in fact, more than free, since each barrel of oil pumped out of the ground could be used to pump many more barrels out of the ground), there was no economic incentive to restrict immigration. In fact, there was an economic incentive to increase immigration – for every new immigrant, the gross national product increased by an amount approximately equal to the gross national product per capita. Getting the energy to “fund” these new immigrants was not a problem, since global oil production was increasing every year. Because America was addicted to growth, immigration soared to very high levels, to the point where its population was growing by about one percent a year (three million people per year), almost solely because of immigration. (US population in 1950 was 152 million; today it is almost double that.)
But all of a sudden, once global production starts to decline, the situation changes dramatically. As long as America can keep its consumption up by taking oil away from other countries, nothing really changes “at home.” But this can go on for only so long, and it cannot continue without a fight. Finally, the point is reached where, short of war, there is no more production to take away from other countries, and America’s oil supply begins to fall. With no oil to fuel the economy, however, all of these immigrants – and the “natives,” as well – represent a cost, not a benefit – they have no energy with which to produce, all they do is consume. At this point, it is very much in America’s interest to send its bloated population – its immigrants as well as its natives – to war. And the more casualties, the better. Each person killed represents a saving of about 8,000 kilograms of oil equivalent (kgoe) per year. If the war effort brings in more oil than would be consumed by the soldier and the war, then fine, the soldier is “paying his way.” But finally, the point is reached where there is simply not enough oil in the world to support America’s thirst for oil. At this point, the only way to reduce US demand for oil is by global war involving massive US casualties, and the only way to reduce global demand for oil is by global war involving massive casualties in the world’s industrial nations.
But the President cannot say that he is sending citizens to war simply to eliminate them, any more than he could say that he was invading Iraq for its oil. Once again, an excuse will be sought. The President will seek excuses to engage in wars with massive casualties. At the present time, the US has only 140,000 soldiers in Iraq, and about one soldier a day is being killed. Eventually, the US will maintain millions of soldiers around the world, guarding its precious oil supply (both from use by other competing users and from destruction from politics-of-envy terrorists). And the casualty count will not be a cost, it will be a benefit. Eventually, the casualty count will be in the millions every year for the US, and on the order of a hundred million per year worldwide. This is easy to see: Hubbert’s curve falls from its current production level to near zero in about forty years. This means that global population will fall from 6.2 billion to about 200 million in forty years. (See Can America Survive? for discussion of this point, viz., that global population is proportional to global energy availability.) This means that, on the average, about (6 billion / 40 years) = 150 million people per year will die every year, worldwide. In the US, the population will fall from about 300 million to about 100 thousand, so that about (300 million / 40 years) = 7.5 million per year. And they will not die of starvation – they will die by war. (Furthermore, it is not likely that the population will decline gracefully, like Hubbert’s curve; as I have discussed elsewhere, the decline is likely to be catastrophic, for a number of reasons (catastrophe theory, systems dynamics, degradation of our environment, overshoot and collapse)).
Watch closely. These dramatic changes are just around the corner. The first clue that things are changing will be when the President will press for sending more troops to Iraq, despite mounting casualties. And then, he will press to send US troops to any large-oil-producing state, to protect the oil assets from destruction by terrorists. And then, he will send troops simply to divert the oil to the US. And perhaps then, the American and British people will begin to realize that their leaders are doing it for them, and doing it for the oil. Their high standard of living cannot continue without access to much – and soon most, and eventually all – of the world’s oil. From the viewpoint of continuing our industrial society, America and Britain must have access to a greater and greater portion of the world’s diminishing oil supply. All countries will soon move aggressively to acquire and or maintain access to the diminishing supply. Soon, American and British leaders will no longer be able to – and no longer have to – make excuses for American and British actions to acquire oil to maintain their industrial societies and the lavish lifestyles of their populations. For a little while longer, however, Americans and Brits may continue to live the illusion that we are taking these actions for humanitarian and altruistic and defensive reasons. Soon, the only reason will be “defensive.” And then, there will be no need for reasons at all. As General George S. Patton once remarked, “You will know what to do.”
From an astrological viewpoint, it is interesting to note that today, August 27, 2003, the planet Mars, God of War, is closer to Earth than at any time in the past 60,000 years.
Added Note (14 September 2003)
Upon rereading this article today, a few weeks after writing it, it occurred to me that I might have said a little more than I did on the topic of what will happen over the next few years. At one point I mentioned, tongue in cheek, that George Bush had “read his Machiavelli well.” Now, I don’t really know whether George Bush has read Machiavelli at all, but I am sure that his advisors have, and that they will influence his decisions in the matter at hand. If you consult Machiavelli (or other historical analysts), it is pretty easy to see what is likely to happen next. The central issue facing George Bush is how to assure that the US has access to substantial amounts of Iraqi oil. But given the way that things have turned out in Iraq, and given the way that things are progressing at the present time, it could conceivably be years, if ever, before the US gains access to substantial amounts of Iraqi oil. On the one hand, saboteurs are destroying the oil production and distribution facilities, and the US military forces seem incapable of stopping them. On the other hand, Bush has said that Iraqi oil will be used to rebuild Iraqi national infrastructure, and, given the deplorable condition of that infrastructure, it could be decades before oil is available for other purposes (i.e., US and British use).
So what to do? Well, let’s read what Machiavelli has to say on this subject. I will quote Section V of The Prince, entitled, “How cities or principalities which lived under their own laws should be administered after being conquered” (quoted from Machiavelli, Niccolò, The Prince, Translated with an Introduction by George Bull, Penguin Books, 1961, reprinted with corrections 1981). “When states newly acquired as I said have been accustomed to living freely under their own laws, there are three ways to hold them securely: first, by devastating them; next, by going and living there in person; thirdly, by letting them keep their own laws, exacting tribute, and setting up an oligarchy which will keep the state friendly to you. In the last case, the government will know that it cannot endure without the friendship and power of the prince who created it, and so it has to exert itself to maintain his authority. A city used to freedom can be more easily ruled through its own citizens, provided you do not wish to destroy it, than in any other way.
“Examples are provided by the Spartans and the Romans. The Spartans ruled Athens and Thebes through the oligarchies they established there, although in the end they lost them. The Romans, in order to hold Capua, Carthage, and Numantia, destroyed them, and so never lost them. They wanted to rule Greece almost as the Spartans did, freely, under its own laws, but they did not succeed; so in order to maintain their power they were constrained to destroy many cities in that province. Indeed, there is no surer way of keeping possession than by devastation. Whoever becomes master of a city accustomed to freedom, and does not destroy it, may expect to be destroyed himself; because, when there is a rebellion, such a city justifies itself by calling on the name of liberty and its ancient institutions, never forgotten despite the passing of time and the benefits received form the new ruler. Whatever the conqueror’s actions or foresight, if the inhabitants are not dispersed and scattered, they will forget neither that name nor those institutions; and at the first opportunity they will at once have recourse to them, as did Pisa after having been kept in servitude for a hundred years by the Florentines. But when cities or provinces are used to living under a prince, and his family is wiped out, since on the one hand they are used to obeying, and on the other have lost their former prince, they cannot agree on the choice of a new prince from among themselves and they cannot live in freedom without one. So they are slower to take up arms, and a prince can win them and assure himself of them more easily. But in republics there is more life, more hatred, a greater desire for revenge; the memory of their ancient liberty does not and cannot let them rest; in this case the surest way is to wipe them out or to live there in person.”
The central issue is one of building and holding an empire, in this case an empire that provides oil to the US and Britain. There have been many great empires in the world, including the Chinese Empire, the Roman Empire and the British Empire, to name just a few. These and other empires were acquired and maintained by skilful use of force and politics. The immediate problem for the US and Britain is what to do in Iraq. Well, prior to the Anglo-American invasion, Iraq was not used to freedom. In fact, it has never been used to freedom. It has no cultural heritage or memory of freedom. Referring to the Machiavelli piece presented above, the surest way for the US and Britain to assume control of Iraq is to install a local puppet government (an oligarchy – not a democracy!), and let them run the country for us, giving us access to large amounts of oil in exchange for continued support of their position. (The option of “going to live there in person,” as, e.g., the present-day Chinese in Tibet, is not considered a viable option for Iraq, since too few Americans and Brits would wish to live there, and installing them there (i.e., building infrastructure to accommodate the US/British lifestyle) would consume much energy.)
It is rather obvious that the US and Britain will never be able to control Iraq, or prevent terrorists from destroying its oil facilities, by direct control (e.g., 150,000 soldiers, or even many times that number). But Saddam Hussein had no problem in running the country, and was not the least bothered by sabotage – without a single foreign troop! As soon as the US and Britain install a loyal puppet government, comprised of Iraqis and having sufficient power to run the country, they may withdraw most of their military forces. The cost of maintaining access to Iraqi oil will then be quite manageable, and they may proceed to move militarily against the next oil target. Just as under Saddam Hussein’s rule, there will be no need to rebuild the Iraqi infrastructure at all. Iraqi oil will soon be flowing to the US and Britain, and to other countries of the industrial world.
Going down the current path of trying to install “freedom and democracy” in Iraq is doomed to failure, and will procure no oil for the US and Britain. Saboteurs will continue to destroy the oil production facilities under our noses (anarchy prevails, since we cannot control the Iraqi population with a small military presence using “Western” methods of force, and we don’t even speak the language!), and a consortium of democratically elected leaders will never feel obliged to us for their positions, as would an installed oligarchy. In case you’re wondering how the new Iraq will differ from the old Iraq…it will be run by someone very similar in methods and performance to Saddam Hussein – the only difference is that his position of power will be totally dependent on the US and Britain, and he will cooperate.
If you take a look at the list presented in Table 3, showing world crude oil supplies by country, ranked by reserve size, it is clear that the preceding strategy applies in most situations. The twenty largest reserves occur (in order of size) in Saudi Arabia, Iraq, United Arab Emirates, Kuwait, Iran, Venezuela, Russia, Libya, Mexico, China, Nigeria, United States, Qatar, Norway, Algeria, Brazil, Oman, Kazakhstan, Angola, and Indonesia. Of these countries, fifteen have little or no cultural history of freedom. The most effective procedure for assuming control of these countries’ oil reserves is to invade militarily, as was done in Iraq, and then install a local oligarchic puppet government. The only countries having a strong, or at least a recognizable, tradition of freedom are Venezuela, Mexico, Norway, and Brazil. In order to take and maintain control of the reserves of these countries, the most effective procedure is to destroy their populations. Note that the US and Britain will not have to invade many of the countries of the list – most of them are already oligarchies that are dependent on US support for their continued existence. Saddam Hussein’s regime was an oligarchy, and it could have continued indefinitely had it accommodated the US. The case of Iraq shows very clearly what will happen to oligarchies that do not comply with US demands for oil.
A few other comments are in order. First, what is the role of the United Nations, and how will other countries react when the US and Britain proceed to invade other countries for their oil? There is a lot of silliness going on at the present time about the role of the United Nations, and its relation to the US and British invasion of Iraq. It is said that we did not fully cooperate with the UN, by not waiting for a second resolution to invade Iraq. But now that the US and Britain are having trouble controlling Iraq, we are asking the UN and other nations to contribute troops to the occupation effort, and to the “reconstruction” effort. As long as the US and Britain proceed on the fruitless approach of trying to control Iraq by military force without the use of a puppet government, and of using the oil to rebuild Iraq’s infrastructure, many more troops and much more money will be required, and the effort will ultimately fail to deliver oil to the US and Britain. From the viewpoint of other countries and the UN, however, this does not matter very much. From a global economic viewpoint, all that matters is that Iraqi oil gets used to increase world economic product. It does not matter to economists (or to the UN, the World Bank, the IMF, or to any other multinational organization dedicated to economic activity and development) whether it is the US or Britain or France or Russia or China or India – or Iraq – that is making use of the oil, as long as it is promoting global industrial production. Because of this, the UN, which is funded by and controlled by global economic forces (synarchism)), will actively advocate and endorse the participation of other countries in the occupation and rebuilding of Iraq.
In other words, it was in the direct best interest of the UN for the US and Britain to proceed with the invasion without its endorsement or consent. Because the UN is a sounding board for so many small and third-world countries, much opposition was publicly voiced within the UN against the US/British invasion. The UN was seemingly in the awkward position of wanting the development of Iraqi oil, and hence the removal of Saddam Hussein, but not being able to say so – it did not want to appear to be in favor of the Anglo-American invasion. The situation was similar to Bush’s and Blair’s assertion that the invasion was for anything but the oil. It was good public relations for the UN leadership to voice disapproval of the invasion, but it (and the economic forces that back it) was in fact very much in favor of a regime change in which Iraqi oil would begin to flow and promote global production and industrialization. Now that the US and Britain have expressed an interest in UN participation in the occupation and reconstruction, the UN is seen as having been vindicated. The fact is, the UN and its economic backers are very pleased with the outcome – and extremely pleased with the methods by which it was accomplished (i.e., an “unendorsed” invasion by the US and Britain, in which the UN could publicly protest the invasion, but then participate in the economic development of its aftermath). The UN knows keenly that the industrial world is crucially dependent on oil. It knows that the only way for economic development and activity to take place is by using oil. For these reasons, given its total commitment to economic development and industrial activity, it will, directly or indirectly, endorse acquisition and use of oil – anyone’s oil – by any means.
The scenario played out in Iraq suited the UN just fine – it provided the world economic forces with access to oil, and yet the UN was able to “keep its hands clean” of the whole messy operation. The UN had “deniability” – it did not even have to give tacit approval to the invasion. This scenario worked well, and it will unfold again. The forces that are opposed to the Western world will soon realize how completely dependent the West is on oil, and how very vulnerable global oil production and distribution facilities are. Before long, there will be massive terrorist attacks against oil production and distribution facilities (by third-world politics-of-envy forces). And very soon, the US and Britain will realize that they simply cannot prevent these attacks by force of arms. The only ways, as Machiavelli noted, are to destroy the populations, or install a sympathetic (obligated, dependent) oligarchy, or “go to live there.” Since the third option is not feasible, either of the first two options will be used. The option of installing an oligarchic puppet government will be applied in countries that do not have a tradition of freedom (i.e., in most situations). The option of destruction will be applied against countries that do.
Finally, what about other countries, such as China, who are not strong allies of the US and Britain? Well, the rather interesting – and perhaps counterintuitive and surprising – thing is that they will not strenuously object to the US/British takeover of Iraq, or to the takeovers of the next few countries to fall to Anglo-American imperialism. Under Saddam Hussein, relatively little oil was pumped. China (for example) had little access to that oil under the previous status quo, and it was in no position to invade Iraq, as the US and Britain did. Under the new status quo, it is the US and Britain that will benefit most (or, more correctly, most directly) from the Iraqi oil, but this does not matter very much to China, since it benefits as well, albeit indirectly. The world oil supply is “fungible” – once Iraqi oil is available, all nations realize some benefit from it, since they all benefit from increased global supply. If the US and Britain are using Iraqi oil, then, at least for the near future, there are other oil sources to which China will have greater access. In the absence of Iraqi oil, the US and Britain would be pressing for a greater share from these other sources, in direct competition with the Chinese. In other words, the key point is that under the present arrangement, there is more oil available to the entire world, and that indirectly benefits China (and other competitors). Eventually, of course, the point will be reached in which the US and Britain control so much of the world oil that China will have access to very little. At that point, conflict will undoubtedly occur.
The US and Britain did not move against Saddam Hussein because he laid 300,000 Iraqis in their graves – millions were murdered in Rwanda and Cambodia, and neither the US nor Britain raised a finger in protest. It did not matter to economic interests how cruel Saddam Hussein was to his own people. His crime, his sin against the West, was to sit on Iraq’s oil and deny its use to the global economy. The US and Britain (and the other nations and multinational organizations of the industrialized West) will agree to any leader of Iraq who develops and uses Iraq’s oil. The religion of the industrial world is economics, and these organizations will, in the final analysis, support whatever promotes economic activity. And economic activity in today’s world is totally dependent on oil.
Any country that attempts to preserve its oil will be charged with constraint of free trade, or hoarding, or “sociopathic behavior,” and the doors to that country’s oil will be “opened” as forcefully as Commodore Perry “opened” the doors to Japan a century and a half ago.
Since advancing the “war on terror” was cited as a primary purpose for invading Iraq, I will make a few comments in that regard. To date, the US is losing the “war on terrorism.” It will eventually realize that it cannot win this war by “hunting down” individual terrorists or terrorist groups, in heterogeneous countries with porous borders. The only way to combat terrorism is to have secure countries – strong nations comprised of single peoples that are homogeneous with respect to language, religion, race, and cultural identity. As noted, the modern industrial world is crucially dependent on oil, and oil facilities are incredibly vulnerable to terrorist attacks. To fight terrorism effectively will require a complete realignment of national borders into culturally homogeneous areas. The nation’s policies to fight terrorism will ultimately align with the nation’s policies for securing access to oil, since destruction of oil facilities will be the major terrorist target. And these policies will have little to do with proselytizing for freedom, democracy, and free trade, which worked well in the early years of the petroleum age to increase the flow of oil to the industrial nations.
The US and Britain will never obtain access to Iraqi oil by means of their current approach, since the cost of that approach is simply more than the worth of the oil that we would obtain from it. And the war in Iraq will not help defeat terrorism by one iota, since terrorism is motivated and enabled by factors that have little to do with Iraq – mass immigration, open borders, free trade, the politics of envy, and the vulnerability of the global oil system. It will not be defeated by the misguided attempt to impose Western values on Moslem nations. The US will quickly abandon its current policies in Iraq, since they will not work. The American public will not be willing to pay for this war or accept its casualties, in return for nothing. Neither will other nations.
In the long term, terrorism is irrelevant. Terrorism will continue unabated throughout the course of the petroleum age because of the politics of envy, because it is vital to industrial activity, and because the industrial world is so very vulnerable. The industrial age will end, however, because the world will run out of oil, not because the forces of terrorism will destroy it. It will destroy itself, by global internecine warfare, as global oil production starts to fall. The certainty and timing of the end of the industrial age is clear, as are the means by which it will happen. The war in Iraq is but the first step along the path that leads to this inevitable conclusion.
My final observations concern “weapons of mass destruction,” the other major reason cited for invading Iraq. Up to the present time, the industrial world has been very concerned over the potential use of weapons of mass destruction, because their use – either by the West or by “terrorists” – would have had a strongly deleterious effect on economic / industrial activity. We are, however, about to enter a new phase of the industrial age / petroleum age, in which there is no longer sufficient energy (oil) to keep the system going. Global industrial production will decline soon, since there will be no oil to fuel it. As global oil production falls, the human population of Earth will fall – all the way back to what it was before the petroleum age began, i.e., to a few hundred million people. As I have argued before, the population will not decrease by means of people simply starving to death, although there will certainly be a great deal of that (especially in the less industrialized parts of the world). The population decreases will occur mainly by war. These resource wars will be motivated by two forces. First, there will be wars to take over oil production facilities. Soon, however, this approach will fail to yield more oil, and it will be recognized that the only way to bring supply into balance with demand is by reducing demand, i.e., by reducing human population in industrialized areas (where the oil is used). As oil production falls, human population will fall commensurably, by an average of a couple of hundred million people per year. And population destruction of this magnitude will not be accomplished by hand-to-hand combat – it will be accomplished by weapons of mass destruction (most likely, nuclear weapons).
(Just to fend off protesting e-mails, please note that I am not at all promoting war – it will happen as the global population drops from six billion to a few hundred million, as global oil production drops from current levels (Hubbert’s Peak) to near zero. The global population will decline since large human numbers are totally dependent on oil, and that decline will involve war. As global oil production starts to fall, weapons of mass destruction will be used to destroy population at at least a commensurate rate. This process will not be motivated by proposals from anybody.)
In promoting the war against Iraq, Bush and Blair cited a number of reasons, including the threat of weapons of mass destruction, terrorism, and Saddam Hussein’s cruelty to the Iraqi people. If any of these pretexts proved to be false, no harm was done. We simply “made a mistake,” but we still would have the oil. Where Bush and Blair erred, however, was in promising that the Iraqi oil would be used to rebuild Iraq’s infrastructure. That pledge, wholly unnecessary, was made because it was thought that such an effort would cost relatively little. It is now clear, however, that the cost of rebuilding Iraq’s infrastructure will use most of Iraq’s oil for years or decades to come, i.e., for most of the remaining duration of the petroleum age. Initially, the cost of this effort will require an investment far exceeding the value of the oil benefit realized. Because the remaining duration of the petroleum age is so short, the US and Britain will never realize any benefit from the invasion of Iraq, if they persist in the folly of rebuilding Iraq.
While economists may not care who benefits from the industrial production resulting from the use of Iraqi oil, the US and Britain certainly do. The American and British publics are not going to invest a massive amount of money to build a country that they did not destroy, and a country that is telling us forcefully (with the continued deaths of US troops) to get out. And no other country is going to help the US and Britain pay for the reconstruction (perhaps simply “construction” is the more appropriate word), either – they will gladly send their construction firms to Iraq to work on contracts paid for by Iraqi oil, but that is the extent of it. Very soon, the US and British populations will refuse to invest further (with either dollars or lives) in building a new Iraq. Bush and Blair will have to renege on their promise. If they don’t, they will soon be out of office, and their replacements will be under no obligation to fulfill their rash promise.
But how can Bush and Blair (or their successors) do this? Would not the US and Britain lose face, and their standing in the eyes of the rest of the world’s nations? No, not at all. Once again, Machiavelli shows the way. I quote from section XVIII of The Prince, “How princes should honor their word.” “Everyone realizes how praiseworthy it is for a prince to honor his word and to be straightforward rather than crafty in his dealings; nonetheless contemporary experience shows that princes who have achieved great things have been those who have given their word lightly, who have known how to trick men with their cunning, and who, in the end, have overcome those abiding by honest principles. …So it follows that a prudent ruler cannot, and must not, honor his word when it places him at a disadvantage and when the reasons for which he made his promise no longer exist. If all men were good, this precept would not be good; but because men are wretched creatures who would not keep their word to you, you need not keep your word to them. And no prince ever lacked good excuses to color his bad faith.”
“A prince, therefore, need not necessarily have all the good qualities I mentioned above, but he should certainly appear to have them. I would even go so far as to say that if he has these qualities and always behaves accordingly he will find them harmful; if he only appears to have them they will render him service. He should appear to be compassionate, faithful to his word, kind, guileless, and devout. And indeed he should be so. But his disposition should be such that, if he needs to be the opposite, he knows how. You must realize this: that a prince, and especially a new prince, cannot observe all those things which give men a reputation for virtue, because in order to maintain his state he is often forced to act in defiance of good faith, of charity, of kindness, of religion. And so he should have a flexible disposition, varying as fortune and circumstances dictate. As I have said above, he should not deviate from what is good, if that is possible, but he should know how to do evil, if that is necessary.”
So, Bush and Blair could simply say that they made the promise to rebuild Iraq based on the assumption that Iraq was in pretty good shape, or based on the assumption that most of the rebuilding could be funded by Iraqi oil. And since neither of these assumptions proved true, the promise is annulled. No reasonable promise is unconditional – it is always made in a context, and in view of some consideration. Bush and Blair promised to rebuild Iraq in the understanding that the cost would be reasonable. But it is not. And they believed that the Iraqi people would be grateful to the US and Britain for their freeing them from the bondage of Saddam Hussein. And they are not. I believe that it was John Maynard Keynes who remarked to someone once, “When the facts change, I change my mind accordingly. What do you do, sir?” There was no “consideration” given by the Iraqi people in exchange for Bush’s and Blair’s promise to rebuild Iraq. Nothing was offered by the Iraqi people in exchange for this promise – not money, not loyalty, not appreciation, and not love. For this reason, there is no moral obligation to fulfill it. At best, the promise could be viewed as a misguided or ill-conceived attempt to convince other nations of the altruistic nature of the invasion, and rally their approval or support (moral or otherwise). But no rational person or nation would expect the US or Britain to rebuild Iraq’s infrastructure at great cost, when it was Saddam Hussein, not the US or Britain, who destroyed it.
So Bush and Blair may renege on their promise without loss of face to themselves or to their nations. If they do not, they will quickly be replaced by men who find no difficulty in doing so. And in that case, their nations will certainly lose no face, since the new leaders will be under no obligation whatsoever to honor a rash promise made by an out-of-office predecessor. An easy way for a democratic nation to “change its mind” is simply to change its leader.
Bush and Blair will not succeed in installing a democratic regime in Iraq. Very soon, control will pass to authoritarian leadership that is beholden to the US and Britain, and the US and Britain will wash their hands of the need to rebuild Iraq and to station large occupation forces there.
Addendum (5 November 2003)
Two days ago a military helicopter was downed in Iraq, claiming the lives of 15 US servicemen. This was the highest single-day casualty amount since the war in Iraq began. As the US and “coalition” casualties mount, discussion will increase over the cost of the war, both in terms of money and lives. This issue will be resolved as it is understood what the true objectives of the war are. If the objective were simply to remove an evil tyrant from power, the US would leave, as it did in Somalia. If the issue were to stop the spread of weapons of mass destruction, the US would leave, since there are none. If the issue were to stop the spread of terrorism, the US would leave, since there is no more terrorism thriving in Iraq than in many other places (e.g., Saudi Arabia, where most of the terrorists of September 11, 2001, attack came from).
But these are not the fundamental reasons for the war. The fundamental reason for the war is access to Iraqi oil. The US and Britain are in Iraq to secure access (by the industrial world) to oil. And, for that objective, the cost is not too high. As world oil supplies run out and the world food supply begins to shrink, billions of people will die in resource wars. At some point in the near future, annual casualties will reach one hundred and fifty million per year, or about half a million a day – thirty thousand times the loss of two days ago. (US and British casualties will be, on average, about one-twentieth of the global total.) Since these people will either starve to death or die in war, they will most likely die in war.
Americans and others should realize that, as Defense Secretary Donald Rumsfeld and others have asserted, that the US is in this war for the long haul. The only reason why the US and Britain would pull out is if it became clear that they (i.e., the industrial world) would not have access to the Iraqi oil, or if it cost more energy to continue the war (and occupation) than was obtained from the oil. If this became clear, they would promptly leave. And about the only way that that would happen is if the Iraqi oil fields became unusable, e.g., by nuclear attack and contamination.
So what will happen in Iraq? I cannot predict the future, but I can identify some likely paths. Once again, it helps to consider what experts on strategy have observed. With respect to the initial military campaign, the US and Britain did everything right. In his work on Sun Tzu (The Art of War, translated and with an introduction by Samuel B. Griffith, foreword by B. H. Liddell Hart, Oxford University Press, 1963) Samuel Griffith writes, “Sun Tzu believed that the moral strength and intellectual faculty of man were decisive in war, and that if these were properly applied war could be waged with certain success. Never to be undertaken thoughtlessly or recklessly, war was to be preceded by measures designed to make it easy to win. The master conqueror frustrated his enemy’s plans and broke up his alliances. He created cleavages between sovereign and minister, superiors and inferiors, commanders and subordinates. His spies and agents were active everywhere, gathering information, sowing dissension, and nurturing subversion. The enemy was isolated and demoralized; his will to resist was broken. Thus without battle his army was conquered, his cities taken and his state overthrown. Only when the enemy could not be overcome by these means was there recourse to armed force, which was to be applied so that victory was gained: (a) in the shortest possible time; (b) at the least possible cost in lives and effort; (c) with infliction on the enemy of the fewest possible casualties.
“National unity was deemed by Sun Tzu to be an essential requirement of victorious war. This could be attained only under a government which was devoted to the people’s welfare and did not oppress them. Sun Hsing-yen was justified in observing that Sun Tzu’s theories were based on ‘benevolence and righteousness’.”
So, if the initial phase of the war in Iraq went so well, why does it seem to be in difficulty now? Well, it appears that Bush and his allies and advisors have not been following the dictates of classical strategy sufficiently closely, and that that has gotten them into a little trouble.
Sun Tzu asserted, “No country has ever benefited from a protracted war.” Samuel Griffith writes, “Sun Tzu appreciated the difference between what we today define as ‘national strategy’ and ‘military strategy.’” With respect to strategy, it is helpful to consult the writings of Sir Basil Henry Liddell Hart for more information and insight. In his chapter on “Grand Strategy” (Strategy, second revised edition, Henry Holt, 1954, 1967) he writes, “The object in war is to obtain a better peace – even if only from your own point of view. Hence it is essential to conduct war with constant regard to the peace you desire. This is the truth underlying Clausewitz’s definition of war as a ‘continuation of policy by other means’ – the prolongation of that policy through the war into the subsequent peace must always be borne in mind. A State which expends its strength to the point of exhaustion bankrupts its own policy, and future.
“If you concentrate exclusively on victory, with no thought for the after-effect, you may be too exhausted to profit by the peace, while it is almost certain that the peace will be a bad one, containing the germs of another war. This is a lesson supported by abundant experience.
“Moreover, regrettable as it may seem to the idealist, the experience of history provides little warrant for the belief that real progress, and the freedom that makes progress possible, lies in unification. For where unification has been able to establish unity of ideas it has usually ended in uniformity, paralyzing the growth of new ideas. And where the unification has merely brought about an artificial or imposed unity, its irksomeness has led through discord to disruption.
“Vitality springs from diversity – which makes for real progress so long as there is mutual toleration, based on the recognition that worse may come from an attempt to suppress differences than from acceptance of them. For this reason, the kind of peace that makes progress possible is best assured by the mutual checks created by a balance of forces – alike in the sphere of internal politics and of international relations.
“The more brutal your methods the more bitter you will make your opponents, with the natural result of hardening the resistance you are trying to overcome; thus, the more evenly the two sides are matched the wiser it will be to avoid extremes of violence which tend to consolidate the enemy’s troops and people behind their leaders.
“Victory in the true sense implies that the state of peace, and of one’s people, is better after the war than before. Victory in this sense is only possible if a quick result can be gained or if a long effort can be economically proportioned to the national resources. The end must be adjusted to the means.”
In his chapter, “Guerrilla War,” Liddell Hart writes, “If you wish for peace, understand war – particularly the guerrilla and subversive forms of war…. A wider and more profound treatment of the subject appeared a century later [after Clausewitz’s On War] in T. E. Lawrence’s Seven Pillars of Wisdom…. Guerrilla war must always be dynamic and must maintain momentum. Static intervals are more detrimental to its success than in the case of regular warfare, as they allow the opponent to tighten his grip on the country and give rest to his troops while tending to dampen the impulse of the population to join or help the guerillas…. Guerilla war is waged by the few but dependent on the support of the many. Although in itself the most individual form of action, it can operate effectively and attain its end only when collectively backed by the sympathy of the masses. That is why it tends to be most effective if it blends an appeal to national resistance or desire for independence with an appeal to a socially and economically discontent population, thus becoming revolutionary in a wider sense.”
As Iraq is currently constituted, there is no way that the US and Britain can control it, or repress the ongoing guerrilla war. A nation is a group of people that is relatively homogeneous with respect to language, religion, race and culture. These terms do not apply well to Iraq. Iraq is similar to the Yugoslavia of a few years ago, and it will, eventually, follow a similar balkanization. It consists of three major groups: the Sunnis, the Shiites, and the Kurds. These groups differ strongly with respect to language, religion, and culture. If the US and Britain wish to control Iraq and benefit from a peace that will allow access to oil, it would be well-advised to break the country into (at least) three parts – one for the Kurds (“Kurdistan”), one for the Sunnis, and one for the Shiites, and to install an oligarchy in each of them.
This division of Iraq into three or more “principalities” will accomplish peace and stability. As Machiavelli observed, “…as soon as a powerful foreigner invades a country all the weaker powers give him their support, moved by envy of the power which has so far dominated them. So, as far as these weaker powers are concerned, he has no trouble at all in winning them to his side, because of their own accord they straight away merge with the state he establishes. All he has to watch is that they do not build up too much strength and too much authority; and with his own strength and their support he can easily hold down those who are powerful and so make himself, in everything, the master of the country. Whoever does not attend carefully to these points will quickly lose what he has acquired; even while he still holds on he will experience countless difficulties and annoyances.
“In these instances, the Romans did what all wise rulers must: cope not only with present troubles but also with ones likely to arise in the future, and assiduously forestall them. When trouble is sensed well in advance it can be easily remedied; if you wait for it to show itself any medicine will be too late because the disease will have become incurable. As the doctors say of a wasting disease, to start with it is easy to cure but difficult to diagnose; after a time, it becomes easy to diagnose but difficult to cure. So it is in politics. Political disorders can be quickly healed if they are seen well in advance (and only a prudent ruler has such foresight); when, for lack of a diagnosis, they are allowed to grow in such a way that everyone can recognize them, remedies are too late.
“So the Romans saw when troubles were coming and always took countermeasures. They never, to avoid a war, allowed them to go unchecked, because they knew that there is no avoiding war; it can only be postponed to the advantage of others.”
The maxim “divide and conquer” applies to Iraq. Divide the country into three or more small nation-states, install an oligarchy in each, and the result will be governable. These three states will be internally stable and beholden to the US and Britain for their continued survival. Terrorism will cease, because it will no longer have the support of discontented masses. The oil will begin to flow. Public order will be restored, as it was under Saddam Hussein. The only difference is that those in charge will be compliant puppets of the US and Britain, which Hussein was not. The present path of attempting to forge a single nation out of disparate parts is doomed to fail. That path will not lead to access to Iraqi oil, but to endless guerrilla attacks on occupying troops and continuing massive expenditures of money. The US and Britain should quickly set up a system of controllable states in Iraq, end the daily slaughter of their troops (and Iraqis), end the flow of money for “rebuilding Iraq,” and facilitate access to the oil. (As I have noted before, from the viewpoint of the industrialized world it does not matter whether the US and Britain have direct access to the Iraqi oil – all that matters is that economic production is taking place with it.) The Iraqi war will have accomplished its desired end – a “better peace” in which the industrial world has access to more oil.
This same principle (of balkanization) will eventually be applied worldwide. The US and Britain are committed ideologically to the principle of self-determination of peoples (at least for others, not for themselves, as we saw from the American Revolutionary War and the War Between the States). Eventually, as world energy supplies decline, all large states will decompose into small ethnic groups. The ethnically homogeneous groups will want this, and the US and Britain will willingly oblige (since it facilitates control). The UN and the World Bank will oblige, because it promotes peace and economic activity. The only thing that holds internally heterogeneous states together today is the high level of energy availability, which can be wasted on the discretionary (and frivolous) activity of holding together countries comprised of diverse groups that can never constitute nations. As world oil supplies dwindle, all large states (and even small internally heterogeneous ones) will quickly fall apart.
Africa will be perhaps the most striking example of this, since it is comprised of very many ethnic groups, and has relatively little access to global oil. Present national boundaries, which were set up by the colonial powers, have little to do with ethnic composition. At the time of independence (1960s), the newly formed African countries complained about these boundaries. In every case, however, no one was willing to redraw them, because that would have resulted in loss of territory. The Congo will be fragmented into many pieces, as will all other African countries. This same fate will eventually befall the rest of the world, as global oil production declines. Eventually, even the US and Britain will experience it, as the world returns to a global hunter-gatherer system.
The US and Britain will not “let go” of Iraq as long as there is any reasonable prospect of gaining access to the oil at an acceptable cost. Although they have blundered somewhat in the months following their spectacular initial military success, they will eventually discover a path to success. US and British leaders should reread Liddell Hart’s chapter, “The Concentrated Essence of Strategy and Tactics.” “Adjust your end to your means. Key your object always in mind. Choose the course of least expectation. Exploit the line of least resistance. Take a line of operation which offers alternative objectives. Ensure that both plan and dispositions are flexible. Do not throw your weight into a stroke while your opponent is on guard. Do not renew an attack along the same line (or in the same form) after it has once failed.” The current approach to “waging peace” in Iraq has failed, but the US and Britain will eventually modify the strategy to a successful one. They will not abandon the oil, because there is no reason to. They will find a way to access it at an acceptable cost. They will soon find a way to return control of Iraq to Iraqis, and remain in control of the oil, and establish conditions under which it can be exploited. And that way will be consistent with the theory of strategy and tactics that has been derived from thousands of years of practical experience.
FndID(61)
FndTitle(It’s the Oil, Stupid (Hubbert's Curve and World War III))
FndDescription(This article will summarize why the invasion of Iraq was considered essential to protecting American and British interests in continuing industrial activity at a high level in the US and Britain.)
FndKeywords(Iraq war; geopolitics; Middle-East peace; oil; petroleum age; economic rationale for war)