DESTINY 2005 Demographic Estimation, Forecasting and Analysis System; Description of Capabilities, International Version3.0.01
I. Introduction
Although planning and policy analysis are perhaps ten percent retrospection and ninety percent prospection, the amount of computer software available to assist these functions is vastly weighted in favor of analyses of historical data, rather than on forecasting the future implications of alternative policies or demographic developments. The software for statistical analysis is well-known and ubiquitous -- SAS, SPSS and many others -- with powerful versions available for desk-top microcomputers. While recent years have seen the advent of much-improved time series analysis forecasting packages, the software available for supporting simulation or projections under alternative assumptions about demographic or programmatic changes is, by comparison, limited and relatively little-used.
A major factor is cost -- a single application of a major microsimulation forecasting program, for example, can cost thousands of dollars to set up, and weeks of time may pass before the final results are available. The exigencies of many planning situations do not allow for the luxury of such slow, high-cost, data-intensive and labor-intensive techniques. Faced with only a few hours to obtain, for example, an estimate of the budgetary implications of a proposed new program regulation or policy, the analyst often has to resort to "back-of-the-envelope guesstimates."
Times have changed! The DESTINY Estimation, Forecasting and Analysis System has been developed to provide the planner with a low-cost, easy-to-use means for making detailed forecasts of target populations, the need for services, the requirement for facilities, equipment, and personnel, and the cost under varying programmatic and demographic assumptions. The time required to implement a DESTINY run ranges from a few minutes to a few hours, and the computer cost is negligible -- a few minutes on a desktop microcomputer. The DESTINY system is a powerful new tool for the planner who needs detailed, state-of-the-art forecasts on a quick-turnaround, low-cost basis.
The essence of planning and policy analysis is the ability to identify potential demographic and economic developments, to synthesize alternative responses to those developments, and to evaluate the impact of those responses. The DESTINY planning and forecasting system has been developed to play a crucial role in this process -- it offers the user the ability to make fast, detailed population projections, and to forecast quantities linked to growth or structural changes in the population.
DESTINY can offer the planner or policy analyst valuable help in making a wide range of forecasts...
In Population Planning, DESTINY can be used to forecast the population by age, sex, and race, or by geographic region and race.
In Education Planning, DESTINY can forecast local-area school enrolments, based on recent trends in birth rates and regional migration.
In Health Systems Planning, DESTINY can project the requirement for health services personnel (nurses, physicians), supplies and equipment (beds, CT scanners), by geographic region.
In Social Services Planning, DESTINY can be used to forecast the levels of need for various social services (counseling, day care, protective services, chore services), the requirement for agency personnel (counselors) and for contract services, and the associated budget. These forecasts can be specified by geographic region, or broken down by age, sex, and race. The budget estimates may be disaggregated by service, by resource (e.g., counselor), or by demographic characteristics of the served population (e.g., age, sex, race, or region).
In Market Research, DESTINY can be used to estimate demand for products or services whose demand is related to demographic changes.
In Criminal Justice Planning, DESTINY can make projections of the prison inmate population, and thereby be used to assist planning for prison construction requirements under different sentencing policies.
The preceding are but a few examples of DESTINY applications. With DESTINY, the user can make forecasts such as the above quickly and easily. The system can be used to make forecasts at national, state, or local levels. The analyst can use DESTINY to answer a wide range of "what-if" type questions. DESTINY eliminates the analyst's dependence on "standard" populations projections that may be too highly aggregated, or may correspond to assumptions that are no longer reasonable. Detailed forecasts, corresponding to alternative demographic or programmatic assumptions, may be developed in a matter of minutes or hours, in most cases using information that is readily available from standard statistical sources.
The DESTINY Planning and Forecasting System is an essential technical resource for anyone engaged in planning who needs to be able to produce detailed demographic-based forecasts quickly and at reasonable cost.
This brochure describes the DESTINY system and illustrates its capabilities by means of several examples.
This “international” version has been tailored for use in developing countries, where the availability of detailed demographic, health and social-system data and highly trained demographers, statisticians and programmers is limited. The standard version of DESTINY allows the user to make population projections under a wide range of assumptions about the future demographic characteristics of a population, by race and regional breakdowns. This version is a simplified version that makes use of World Bank population projections for 193 countries.
II. What DESTINY Does
DESTINY is a computer-program system that is used to forecast the general population, special "target" or "served" populations of interest, demand for services to these populations, and the amounts of resources (personnel, facilities, equipment, supplies) and cost required to provide these services to the target population. It is designed to provide fast, detailed forecasts in applications in which the items of interest (target populations, served populations, services, resources, and cost) vary roughly in proportion to the sizes of various segments of the general population, such as age/sex/race/geographic-region categories. (For the International Version, the population segments are restricted to age and sex.)
A major use of the DESTINY system is to support policy analysis and program evaluation in service-oriented fields, such as health care, social services, education, and public safety. DESTINY can be used to develop service forecasts and budget estimates under a variety of demographic and programmatic assumptions, and to generate detailed breakdowns (tables and crosstabulations) of these forecasts by age, sex, race, and geographic-region categories.
Forecasting models based on population projections are not new. In general, however, the amount of data and computation required to develop a detailed population-based forecast is substantial, since to achieve an acceptable level of accuracy the method requires estimates of the future population broken down by age, sex, race, and region. While a few total-population projections may be readily available from national or state-level agencies, it is usually not possible to obtain detailed projections (disaggregated by age, sex, race, or region) quickly, corresponding to arbitrary demographic assumptions, particularly at the local level. One of the major features of the DESTINY system is its ability to generate detailed population projections rapidly, corresponding to a wide range of demographic assumptions (concerning fertility, mortality, and migration).
Except in the field of population planning, most forecasting applications are not directly concerned with projections of the general population, but instead with special "target" subpopulations, such as the physically or mentally ill, the disabled, the student population, or the prison population. The DESTINY system can be used to provide forecasts of these special subpopulations, and forecasts of the resources and cost required to provide specified services to them. Furthermore, these forecasts can be broken down, or disaggregated, by detailed demographic characteristics -- by age, sex, race, and geographic region.
At the local level, planners are often confronted with the problem of estimating numbers of persons with certain characteristics (e.g., acute illnesses, chronic health conditions, disabilities, or social problems) or the number of population-related events (e.g., school or prison admissions), but there is usually no usable Census or sample survey information on incidences or prevalences of these characteristics at the local level. What is often available, however, are national or regional sample survey data that indicate the incidence or prevalence, broken down by detailed demographic categories, such as age, sex, and race. In the absence of local-level incidence/prevalence data, the planner must use this national or regional information to develop local-area estimates. In this situation, a recommended procedure for estimating the numbers of persons having the specified characteristics in the local area is synthetic estimation. With this procedure, the national incidences or prevalences for various age-by-sex-by-race categories are multiplied by the total numbers of persons of the general local-area population in these categories, to obtain estimates of the numbers having the specified characteristics in the local area. DESTINY has the capability for rapidly computing synthetic estimates. With this feature, the local planner can quickly construct reasonable target population estimates which make full use of available regional or national incidence/prevalence data.
While the DESTINY system can be quickly used to construct target-population estimates based on available incidence/prevalence rates (specific to age x sex x race categories), it can also be used in conjunction with other forecasting procedures to produce high-precision forecasts. For example, an analyst may use a multiple regression model, or an autoregressive integrated moving average (ARIMA or Box-Jenkins) time-series model, or a dynamic systems model to develop a precise forecast of a future incidence rate for a specific demographic category (e.g., arrest rates for males aged 20-35). This estimated arrest rate can then be input to the DESTINY system to forecast total number of arrests for a local area, taking into account not only trends in the arrest rate, but also anticipated trends in birth rates, death rates, migration, and population aging.
DESTINY has been designed to enable the planner to obtain forecasts of the general population, target populations, served populations, service needs, and the resources and cost required to provide these services. These projections can be made under a variety of "what-if" assumptions concerning demographic and programmatic conditions. The analyst can make alternative assumptions regarding population growth, target population incidences or prevalences, program service ratios, and costs. The corresponding projections can be computed quickly, and can be disaggregated by age, sex, race, and geographic region. DESTINY offers the user the ability to make detailed forecasts quickly and easily, at substantial savings over manual or partially-automated procedures.
III. How to Use the DESTINY System
The DESTINY system was designed to provide a substantial analytical capability to the user, but it was also designed with ease-of-use in mind. The DESTINY system works by setting up a mathematical representation, or "model," of the population, and using this model to project the future. To use the system, the user needs to set up a "parameter" file containing the following information:
Demographic Information
o Total Fertility Rate (World Bank (“WB”) data used in International version)
o Fertility Age Distribution (WB data used in International version)
o Infant Mortality Rate or Expectation of Life at Birth (WB data used in International version)
o Base-year Population, by age and sex (race optional) (not included in International version)
o External Migration Rates or Amounts (WB data used in International version)
o Regional Populations (optional) (not included in International version)
o Regional Migration Rates or Amounts (if regions are included in the model) (not included in International version)
Target Population Information (Optional)
o Incidences (rates of occurrence of events) or Prevalences (proportions of the general population belonging to subpopulations of interest), either overall or by age and/or sex and/or race and/or region (overall or by age and/or sex in International version)
Served Population Information (Optional)
o Service Ratios (proportions of the target populations that are served), either overall or by age and/or sex and/or race and/or region (overall or by and and/or sex in international version
Service Information (Optional)
o Average number of service units per year per case served (a “case” is a member of the served population)
Resource Information (Optional)
o Average number of resource units per year required per service unit expended
Cost Information (Optional)
o Average cost per resource unit
Names
o The names of the races, regions, target populations, served populations, services, resources, and cost categories (races and regions omitted from International version).
If only general population projections are desired, (i.e., no target population or service projections are desired), the user need specify only the demographic parameters. If a detailed program cost estimate is desired, all of the information must be specified. The demographic data are available from standard statistical publications, such as national and state vital statistics annual reports or statistical abstracts. The target population incidence/prevalence data are available from Census publications, national sample survey reports, agency publications, and statistical abstracts. The service, resource, and cost data are generally available from program administrative records.
The process of setting up the parameter file requires a little effort, but once the data are input to the computer, they are stored on disk and are easily updated.
While running the program, the user needs also to specify the following parameters:
o how many five-year periods to project (limited to three for synthetic estimates, in the International)
o what tabular output is desired for the various population, service, resource, and cost projections
With regard to output, the program computes projections for the following items:
o the general population
o the specified target populations
o the specified served populations
o service units
o resource units
o cost (by cost category (element) or total)
The program can generate aggregate projections for each of the above quantities, and will (at the user's option) provide disaggregated projections, by age and/or sex and/or race and/or region (by age and/or sex for the International version).
The standard version of the DESTINY system is set up to accommodate up to three races, fourteen regions, four target populations, ten services, seven resources, and four cost categories. The International version of the DESTINY system is set up to accommodate one target population, one served population, up to ten services, ten resources, and ten cost categories.
IV. Special Features of the DESTINY System
The DESTINY system is designed to accommodate a wide range of detail in both the input and output. In setting up the parameter file, the user may specify that the same value of a demographic or service-system parameter for the entire population for all future time. On the other hand, quite detailed demographic or programmatic specifications may be made, to obtain highly "conditioned" projections.
With regard to specifying incidence/prevalence rates for the target and served populations, DESTINY offers the user the choice of a number of different demographic "stratifications." The user may specify that the same rate applies to the entire general population, or that the rates vary according to various demographic classifications, or stratifications, of the general population. Specifically, the user may specify rate stratifications by age, sex, race, age x sex, age x race, sex x race, age x sex x race, region, or race x region. With this flexibility, the analyst may make use of a wide variety of available crosstabulation data from national surveys, to construct synthetic estimates of target populations for the local area. (For the International version, the incidence/prevalence rates may be specified by eight different stratifications: none, age, sex, age by sex, year, year by age, year by sex, year by age and sex.)
In technical terms, the DESTINY system uses the "cohort-component" method for making its population projections. This method is the most widely-used analytical method for preparing regional population projections. (Shryock, Siegel, and Associates, The Methods and Materials of Demography, US Government Printing Office, Washington, DC, 1980, presents a detailed description of this method.) For the target population estimates, the program uses the method of synthetic estimation (also known as cohort-component participation rates). (As mentioned, the International version uses the cohort-component population projections provided on the World Bank World Development Indicators CD.)
The system is set up to enable parameter input and updating interactively through the computer screen. The specified parameters are stored on disk for future use. The projections may be viewed on the screen or printed.
The user may specify either brief aggregated projections, or detailed disaggregated projections, in the form of tables by age, sex, race, or region. In addition to demographic tables (such as a breakdown of service utilization by race or region), the user may request tables of services by target or served population; resources by service, served population or target population; and cost by resource, service, served population or target population.
V. Examples
This section presents a number of examples of DESTINY applications. For the International version of DESTINY, the examples apply to the country of Zambia. These examples include:
o Projection of the General Population
o Projection of Various Target or Served Populations
o HIV/AIDS
o Basic school-age children and school enrolments (grades 1-9)
o Projection of Service Needs
o HIV/AIDS services (VCT, ART, CSM)
o Formal schooling services (grades 1-9)
o Projection of Resource Requirements
o Personnel, drugs, other supplies, vehicles, other equipment, facilities, outside services
o Teachers, classrooms, desks, textbooks (grades 1-9)
o Projection of Program Costs
o HIV/AIDS
o Basic schooling (grades 1-9)
The following examples illustrate the wide range of applications of the DESTINY system. They also illustrate the varying levels of detail which are possible. On the one hand, the user may use the program to construct a single estimate of the total population; on the other hand, the user may request a detailed breakdown of a target population (e.g., the HIV/AIDS population) by age, sex and year, or a breakdown of costs for basic-school services by service and resource type, by year.
While the examples presented here illustrate the possible levels of detail of DESTINY projections, they do not represent examples of policy analysis exercises. In a real planning or policy analysis situation, the user would very likely make a set of DESTINY runs, under a wide range of alternative demographic and programmatic assumptions (“what if” studies). DESTINY is ideally suited for such use, since it stores all of the input data in "parameter" tables, which the user may easily modify with the touch of a few buttons on the computer keyboard. Hence, while the first DESTINY run requires some effort (to assemble the needed data and set up the parameter tables), successive runs are easily and quickly accomplished.
The examples and the principal features of each are listed below. They are presented in order of increasing complexity. As mentioned, the examples use Zambia data. The examples are illustrated using actual system output, although some of the input data are hypothetical. The projections are made from a "base year" of 2000 to the year 2015 (for synthetic estimates – longer for World Bank population projections). The user may structure the system output in a variety of ways, requesting projections for various years and requesting different tables for different years (e.g., detailed breakdowns for 2005, and summary aggregations for 2010 and 2015). These examples illustrate the wide variety of the program output.
Example 1. National Population Projection
Demographic representation: single population (i.e., the total population), single geographic region (i.e., the entire country)
Service-system representation: none
Example 2. Health: Projection of HIV/AIDS Services
Demographic representation: single population, single region
Service-system representation: one target populations (the general population), one served population (the population receiving program services), two services (VCT, CSM), seven resources (personnel, drugs, other supplies, vehicles, other equipment, facilities, and outside services), and seven cost categories (corresponding to each of the resource types)
Example 2. Health: Projection of HIV/AIDS Services
Demographic representation: single population, single region
Service-system representation: one target populations (HIV/AIDS infected), one served population (HIV/AIDS infected ART treatment), one service (ART), seven resources (personnel, drugs, other supplies, vehicles, other equipment, facilities, and outside services), and seven cost categories (corresponding to each of the resource types)
Example 4. Education, Projection of Basic-School Enrolment
Demographic representation: single population, single region
Service-system representation: one target population (citizens of basic-school age), one served population (basic-school students), one service (formal schooling), four resources (teachers, classrooms, desks, textbooks), and four cost categories (salaries, facilities, equipment, supplies)
Example 1. National Population Projection by Age and Sex
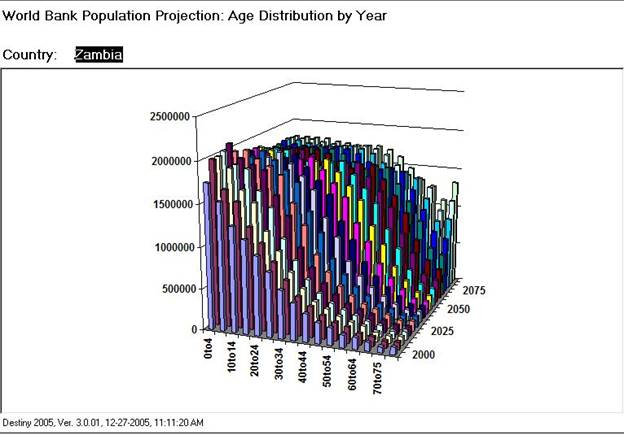
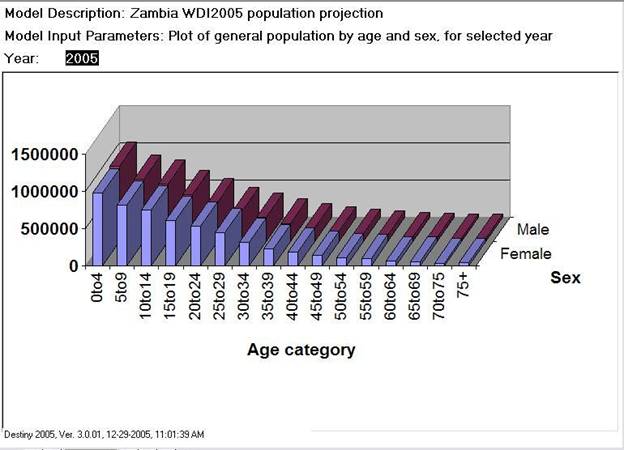
This example illustrates the most basic application of DESTINY -- projection of a general population by age and sex. In this example, the resident population of Zambia is projected from the base year of 2000 to 2090. For projections up to 2015, the system output includes all possible tables involving age and sex: a table of the population by age, a table by sex, and a table by age and sex. The presentations below include: a graph showing the Zambia population projected from 2000 to 2090; a graph showing the age distribution of the population over this same period; a table showing the projected population by year from 2000 to 2015; and a graph showing the age-by-sex distribution in 2005.
The system can produce output in default (“standard”) graphical or tabular form, on demand. DESTINY users who know how to use the Microsoft Access database system can use the DESTINY output tables to produce a wide variety of other tables (e.g., crosstabulations) and reports. As users of MS Access well know, the design of a custom-tailored report can consume a large amount of time. The DESTINY output data are stored in a small number of highly “normalized” tables from which reports may be quickly produced using the MS Access report “wizard.”
The data on which this projection is based were taken from the World Bank World Development Indicators CD for the year 2005.
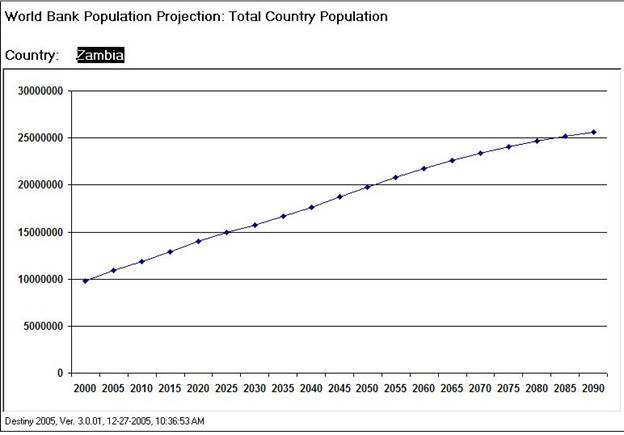
Projection of Zambia Population by year, 2000-2015 (data from World Bank 2005 WDI CD)
|
Year |
Value |
|
2000 |
9842000 |
|
2001 |
10057600 |
|
2002 |
10273200 |
|
2003 |
10488800 |
|
2004 |
10704400 |
|
2005 |
10920000 |
|
2006 |
10920000 |
|
2007 |
11114400 |
|
2008 |
11308800 |
|
2009 |
11503200 |
|
2010 |
11697600 |
|
2011 |
11892000 |
|
2012 |
12095600 |
|
2013 |
12299200 |
|
2014 |
12502800 |
|
2015 |
12706400 |
Example 2. Projection of HIV/AIDS Services to the General Population
This example and the next one illustrate a typical use of the DESTINY system – the estimation of a target population based on available incidence or prevalence data, and the estimation of services, resources and costs associated with the provision of service to a segment of the target population (i.e., to a “served” population). This example illustrates the application of the technique of "synthetic estimation," by which incidence/prevalence rates by demographic category are used to construct estimates of future caseloads, and specified service rates, resource utilization rates, and unit costs are used to estimate future service requirements, resource requirements and costs.
This example is based mainly on hypothetical service-system data (target and served population incidence/prevalences; service, resource and cost parameters). It is intended to illustrate the functionality of the DESTINY system. In a real setting, it would be necessary to expend time to identify units of service, resource and cost, and to obtain reasonable estimates or “what if” ranges for the various model parameters.
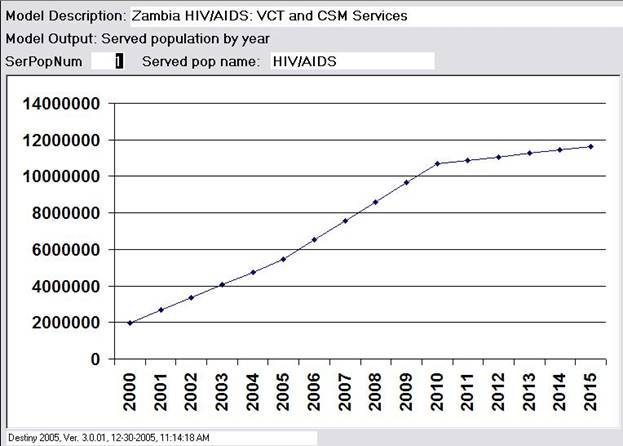
This example is concerned with the provision of HIV/AIDS-related services to the general population: voluntary counseling and treatment (VCT) and community sensitization and mobilization (CSM). The next example will address provision of antiretroviral drug therapy (ART) treatment to HIV-positive persons. The provision of HIV/AIDS-related services has been split into two examples because the target populations for the services are different. (The standard version of DESTINY can handle two or more target populations in the same model, but in the International version a model is restricted to a single target population.) Much of the VCT and CSM services are provided to the general population, whereas the ART services are provided only to the HIV-positive population. A second reason for splitting the example is that the outreach services are likely to be “supply driven” (i.e., the budget specified by budget policy or availability of funds) whereas the treatment services are likely to be “demand driven” (e.g., if government policy is to provide ART treatment to all HIV-positive persons).
To reduce the complexity of the DESTINY system, service units, resource units and cost units are not labeled – the units used in the examples may be as desired by the user. For example, program costs may be denominated either in Zambia Kwacha or in an international currency, such as the US dollar. This is the approach used in many statistical analysis programs. The units (of time, service, resource, and cost) may be very specific, well defined entities, or they may represent very general groupings of diverse elements.
In this first example dealing with HIV/AIDS, the served-population unit (or “case”) is a member of the general population (to whom services are provided) and the time unit of analysis is one year. The service rates are amounts of service (of each type) provided to each served person per year. For example, the service rate for voluntary counseling and treatment (VCT) is the average amount of VCT service (however defined) provided per served person per year. An exact specification of the physical composition of these services is not required – the service may be a single, well-defined service (e.g., a single Community Sensitization and Mobilization (CSM) training session conducted for 75 teachers over three days) or a “basket” of expected amounts of many different types of service, provided by many different service providers, per case, over the course of a year. The resource utilization rates are the average amounts of resource (of each type) provided per unit of service (for each type of service specified). Cost is specified by cost category (element of cost), and may be specified in local or international currency. In this example, a separate cost category is specified for each resource type. In this example, the “Personnel Cost” category might represent all personnel costs of all service providers and government monitoring personnel for a year, or it might represent simply government program personnel, with contract personnel costs included in “Outside Services.”
In this example and the one that follows, the service, resource and cost types are purely illustrative – they may be defined and specified and measured as desired by the user. This example will focus on estimation of program cost, with no attention given to estimation of specific service or resource elements. To keep this example simple, it is assumed that each case (member of the served population) utilizes one unit of each service, that the various services utilize different resources, that each unit of service utilizes exactly one unit of the resources that it does utilize, and that a separate cost category is defined for each resource type. Costs are assumed to be denominated in United States dollars (USD). As mentioned, the numbers are hypothetical, intended solely to demonstrate the type of output produced by the system.
In this example, the target population is the entire Zambian resident population. As mentioned, the entire population is used as the target population since the focus is on services are provided to the general population (e.g., CSM), not just the HIV-positive or active-AIDS segments. (If the focus of this example were exclusively on services provided to the HIV-positive population, then the target population would have been defined as all HIV-positive persons. Similarly, if the focus were exclusively on Ministry of Education employees, then the target population would have been defined as such.) The served population is all persons receiving government-funded HIV/AIDS-related services (preventative or treatment). In this case, the prevalence rate is specified as 1.0 for all demographic groups.
For this example, we shall assume that services are provided to 20% of the target population in year 2000, to 50% of the target population in 2005, and to 90% of the population in 2010 and 2015 (with linear interpolation in intermediate years). We shall assume that each CSM case costs an average of one US dollar per year ($0.8 for personnel, $0.1 for vehicles, $.07 for other equipment, $.03 for facilities); that CSM services cost $0.1 per case per year; and that all of the CSM services are provided as “outside services” (e.g., services provided by contractor personnel). In a real setting, these parameter values would be obtained from policy decisions (e.g., about the proportion of the population to be served each year, and the level of service or service modality to be employed) and historical unit-cost data (e.g., the average cost of providing CSM services per person per year). Normally, the costs of durable assets (vehicles, facilities) would be the annualized expense, not the total purchase price. (The resources specified in this example include “drugs” and “other supplies,” both of which occur at zero levels of utilization. Those zero-level resources are included in this example so that the resource sets are the same for this example and the next one.)
The Zambia population data are already included in the system (i.e., the World Bank population projection), and so it is necessary only to specify the service-system parameters as input data to the model. These parameter values are as shown below.
Model Input Data
Target Population: The entire resident Zambia population.
Served Population as a fraction of the target population:
Year Fraction
2000 .2
2005 .5
2010 .9
2015 .9
Service units per case (member of the served population) (per year)
Service Service Units per Case
VCT 1
CSM 1
Resource units utilized per service unit (per year)
Resource Units per Service Unit
Resource VCT CSM
Personnel 1 0
Drugs 0 0
Other Supplies 0 0
Vehicles 1 0
Other Eqpt 1 0
Facilities 1 0
Outside Svcs 0 1
Cost per resource unit (USD per year)
Cost per Resource Unit
Cost Category Pers Drugs OtSup Vehic OthEq Facil OutSvcs
Personnel cost $0.80
Drugs cost 0
Other supplies cost 0
Vehicles cost $0.10
Other eqpt cost $0.07
Facilities cost $.03
Outside svcs cost $.10
Model Output
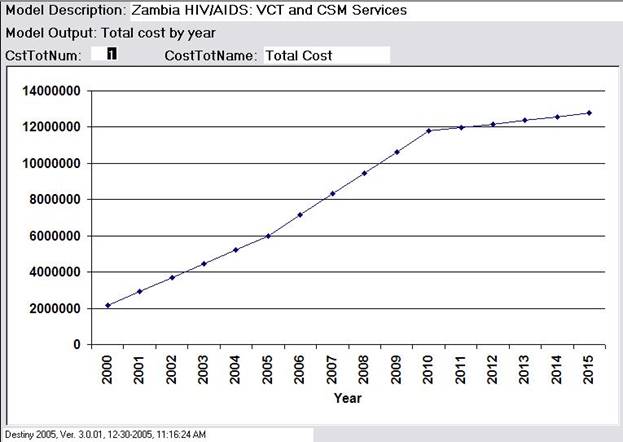
The DESTINY system produces a very large variety of output, both in graphical and tabular format. Below are presented two of the graphical displays produced by the system. The first graph shows the total number of cases served per year and the second graph shows the total cost of service per year, under the assumptions specified above, over the projection period 2000-2015. The total-cost graph shows that, under the above assumptions, the program cost would rise from about two million dollars a year to about 12 million dollars a year. If the latter cost were considered too high, attention (in a real application) would then focus on changing the assumptions (service modalities, unit costs) to bring the long-term budget to a manageable / sustainable level. In a few minutes, the program or budget analyst can examine a variety of alternative cases, and produce professional-caliber graphs that clearly show the implications of the assumptions made.
For tabular output, the user may request the system to produce tables summarizing the output for a wide variety of selections and aggregations of the system output, such as a table showing cost by year, service and resource type, or cost by year, age and sex.
Since the DESTINY system uses the Microsoft Access database system, all of the graphical and tabular output may be “copied and pasted” into other Microsoft Office applications, such as the Microsoft Word word-processing program and the Microsoft PowerPoint slide-presentation system. For users familiar with Microsoft Access, presentation-quality reports may be produced and exported to Microsoft Word, and tables and queries may be exported to the Microsoft Excel electronic spreadsheet system. In short, the DESTINY system offers the program analyst the capability of quickly examining the caseload and budget implications of a wide variety of program options over future time, and the ability to present the analysis results in presentation-quality formats, either as direct output of the DESTINY system or with little additional processing.
Example 3. Projection of HIV/AIDS Services to the HIV-Infected Population
This example continues the previous one. The previous example was concerned with provision of HIV/AIDS-related services to the general population, whereas this one is concerned with provision of services just to the HIV-positive population. In this example we examine the provision of antiretroviral-drug therapy (ART) treatment to the HIV-positive population.
For this example, it is necessary to estimate the proportion of the Zambian population that is HIV-positive. In the DESTINY system, the prevalence of a condition (such as HIV status) is specified as a proportion of a demographic segment of the population. The detail level of the specification depends on the availability of data. If all that is known is a single prevalence for the entire population (e.g., 20%), then that is what is used. If the prevalence is known by age and sex category, then that level of specification is used. In this hypothetical example, we shall assume that the present rate of infection is about 20% of the population, and that it is distributed over the age cohorts to reflect the mortality levels shown in Figure 6.1, “Age-specific mortality at 20% HIV seroprevalence in a population,” of AIDS in the Twenty-First Century: Disease and Globalization by Tony Barnett and Alan Whiteside (Palgrave/Macmillan/St. Martin’s Press, 2002). In this illustrative example, we shall assume that the prevalence is the same for men as for women. It is assumed that the prevalence is the same for 2000 and 2005, declining to half those levels by 2015 (even if treatment is extended to a large proportion of the population, the prevalence will not drop fast because already-infected persons remain alive). Any of these assumptions may be changed, as desired, and the model respecified accordingly.
As in the preceding example, we shall assume that services are provided to 20% of the target population in year 2000, to 50% of the target population in 2005, and to 90% of the population in 2010 and 2015 (with linear interpolation in intermediate years). It is assumed that the average cost of treatment per case per year is USD125.00 ($1.00 for personnel, $100.00 for drugs, $10.00 for other supplies, $2.00 for vehicles, $1.00 for other supplies, $1.00 for facilities, and $10.00 for outside services). These cost categories are the same as in the preceding example, so that the costs could be added together by category in a cost analysis of these two HIV/AIDS program components.
The model parameter values are as shown below.
Model Input Data
Target Population: The HIV-positive segment of the Zambia resident population.
Age Prevalence
Cohort 2000 2005 2010 2015
0-4 .10 .10 .075 .05
5-9 .01 .01 .0075 .005
10-14 .05 .05 .0375 .025
15-19 .20 .20 .15 .10
20-24 .30 .30 .225 .15
25-29 .35 .35 .2625 .175
30-34 .30 .30 .225 .15
35-39 .25 .25 .1875 .125
40-44 .20 .20 .15 .10
45-49 .15 .15 .1125 .075
50-54 .10 .10 .075 .05
55-59 .10 .10 .075 .05
60-64 .05 .05 .0375 .025
65-69 .05 .05 .0375 .025
70-75 .01 .01 .0075 .005
75+ .01 .01 .0075 .005
Served Population as a fraction of the target population:
Year Fraction
2001 .2
2006 .5
2011 .9
2016 .9
Service units per case (member of the served population) (per year)
Service Service Units per Case
ART 1
Resource units utilized per service unit (per year)
Resource Units per Service Unit
Resource ART
Personnel 1
Drugs 1
Other Supplies 1
Vehicles 1
Other Eqpt 1
Facilities 1
Outside Svcs 1
Cost per resource unit (USD per year)
Cost per Resource Unit
Cost Category Pers Drugs OtSup Veh OthEq Facil OutSvcs
Personnel cost $1.00
Drugs cost $100.00
Other supplies cost $10.00
Vehicles cost $2.00
Other eqpt cost $1.00
Facilities cost $1.00
Outside svcs cost $10.00
Model Output
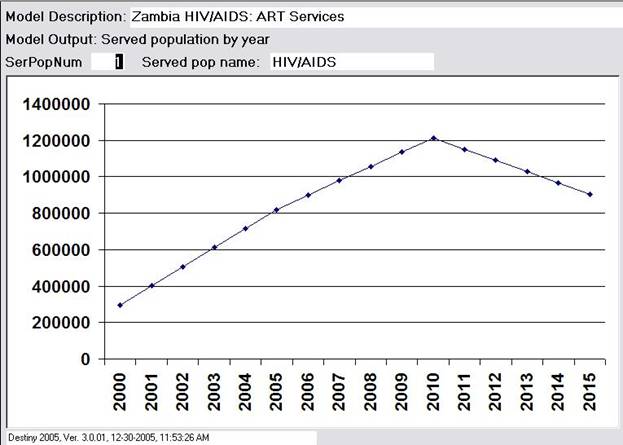
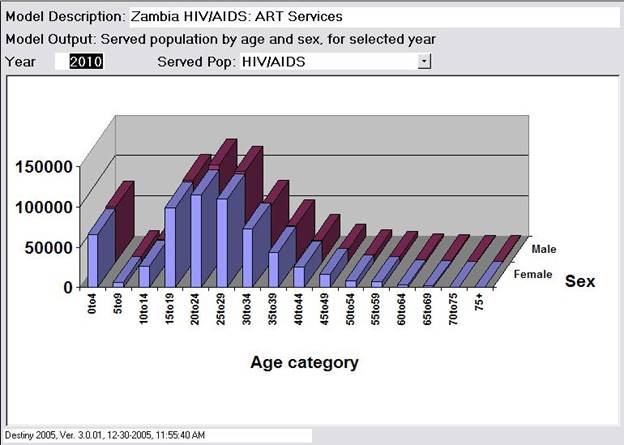
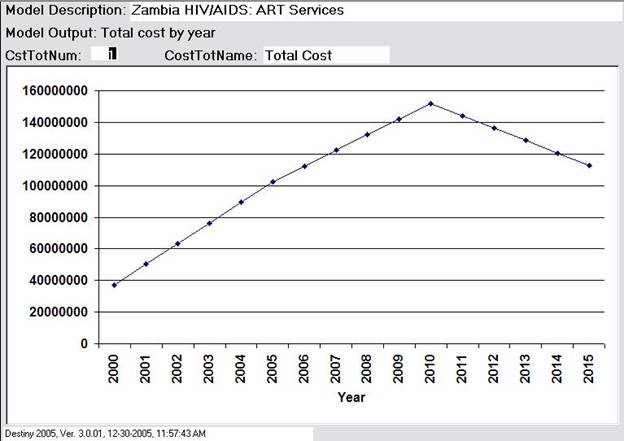
Below are presented three of the many graphs presented by the DESTINY system. The first shows the total population served (ART services) over the projection period 2000-2015. The second shows the population served, by age and sex, for the year 2010. The third graph shows the total cost of service over the projection period.
Example 4. Education, Projection of School Enrolment and Related Quantities
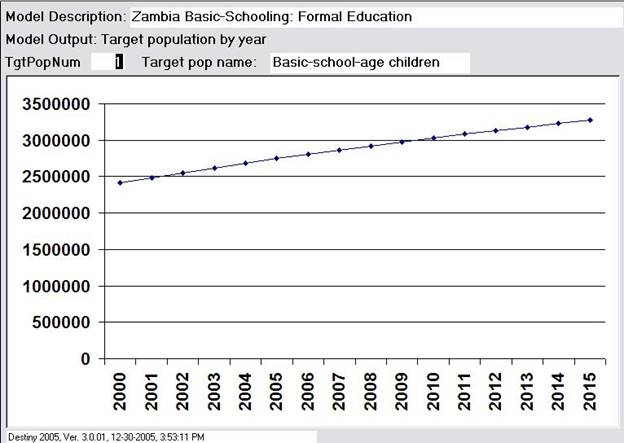
This example illustrates the estimation of requirements for teachers, classrooms, pupil desks, and textbooks for the Zambia basic-school system (grades 1-9). In this case, the target population is all children aged 7-15, and the served population is the portion of this group that is enrolled in basic school.
The number of teachers is estimated by applying a pupil/teacher ratio of 40/1 to the estimated pupil population (children of age 7-15). The number of classrooms is estimated using this same ratio. The number of desks required is set equal to the number of pupils. The number of textbooks is set equal to two per pupil. The total salary cost of the teachers is estimated assuming an average salary of (USD)$400 per year. The cost per classroom is assumed to be $100 (annualized expense), and the cost per desk is assumed to be $10 (annualized expense). The cost per textbook is assumed to be $10.
In this example, we shall estimate the requirements for teachers, classrooms, desks, and textbooks by assuming that the enrolment rate continues in the future to be as in the past. It would take but a few minutes to prepare a second model in which requirements were estimated under the assumption that all school-age children were enrolled in school.
To construct a DESTINY model to produce these estimates, data are needed on the pupil enrolment by age and sex. These data are available from the EdAssist Education Management Information System, developed for the Zambia Ministry of Education by the Academy for Educational Development with funding support from the US Agency for International Development and other sources. This system provides the following school-enrolment data.
S103: Age-Specific Enrolment Ratio (ASER) by Gender
Reporting Level: National
Selection Year: 2004; Province: All Provinces; District: All Districts
30-Dec-05
Age Male ASER Female ASER Total ASER
7 52.70% 56.72% 54.71%
8 79.88% 82.49% 81.19%
9 93.60% 93.61% 93.60%
10 100.63% 98.54% 99.58%
11 95.19% 92.76% 93.97%
12 96.99% 93.27% 95.12%
13 89.93% 85.51% 87.70%
14 81.79% 73.50% 77.62%
15 69.71% 59.43% 64.54%
16 59.02% 44.66% 51.78%
17 48.60% 31.00% 39.70%
18 64.24% 30.98% 47.39%
National 78.56% 71.91% 75.22%
Overall Rate 78.56% 71.91% 75.22%
Source: Zambia Annual School Census ED*ASSIST/Zambia 1
An erroneous report might be due to incomplete data.
The DESTINY system processes data that are categorized in five-year age cohorts (as is the case with most demographic data systems), so it is necessary to process the above data a little to get it in the desired form. The following list of calculations (linear averaging) shows how this is done.
Male enrolment ratio, ages 0-4: 0
Female enrolment ratio, ages 0-4: 0
Male enrolment ratio, ages 5-6: 0
Male enrolment ratio, ages 7-9: (.5270 + .7988 + .9360)/3 = .7539
Male enrolment ratio, ages 5-9: .4 x 0 + .6 x .7539 = .47634, say .45
Female enrolment ratio, ages 5-6: 0
Female enrolment ratio, ages 7-9: (.5672 + .8249 + .9361)/3 = .7761
Female enrolment ratio, ages 5-9: .4 x 0 + .6 x .7761 = .46566, say .47
Male enrolment ratio, ages 10-14: (.10063 + .9519 + .9699 + .8993 + .8189)/5 = .9290, say .93
Female enrolment ratio, ages 10-14: (.9854 + .9276 + .9327 + .8551 + .7350)/5 = .8872, say, .89
Male enrolment ratio, age 15: .6971
Male enrolment ratio, ages 16-19: 0
Male enrolment ratio, ages 15-19: .2 x .6971 + .8 x 0 = .13942, say .14
Female enrolment ratio, age 15: .5943
Female enrolment ratio, ages 16-19: 0
Female enrolment ratio, ages 15-19: .2 x .5943 + .8 x 0 = .11886, say .12
The above calculations yield the following table for estimating the served population (the population of official school age that are enrolled in basic school) as a proportion of the total population.
Served Population (official basic-school-age children enrolled in basic school
Basic-School
Age Enrolment Rate
Cohort Male Female
0-4 0 0
5-9 .45 .47
10-14 .93 .89
15-19 .14 .12
20-24 0 0
25-29 0 0
30-34 0 0
35-39 0 0
40-44 0 0
45-49 0 0
50-54 0 0
55-59 0 0
60-64 0 0
65-69 0 0
70-75 0 0
75+ 0 0
Target Population (official basic school-age children)
The target population is simply the portion of the total population that is of official school age, which is 7-15 for the Zambia basic-school system. Using the same procedure as above yields the following table for estimating the target population as a proportion of the total population.
Official Basic-School-
Age Age Population Rate
Cohort Male Female
0-4 0 0
5-9 .6 .6
10-14 1.0 1.0
15-19 .2 .2
20-24 0 0
25-29 0 0
30-34 0 0
35-39 0 0
40-44 0 0
45-49 0 0
50-54 0 0
55-59 0 0
60-64 0 0
65-69 0 0
70-75 0 0
75+ 0 0
Service units per case
The service in this example is formal basic-school education. That is, there is a single service, “formal education.”
Service Service Units per Case
Formal Education 1
Resource units utilized per service unit (per year)
Resource Resource Units per Service Unit
Teachers .025
Classrooms .025
Desks 1
Textbooks 2
Cost per resource unit (USD per year)
Cost per Resource Unit
Cost Category Teachers Classrooms Desks Textbooks
Teacher cost $400.00
Classroom cost $100.00
Desk cost $10.00
Textbook cost $10.00
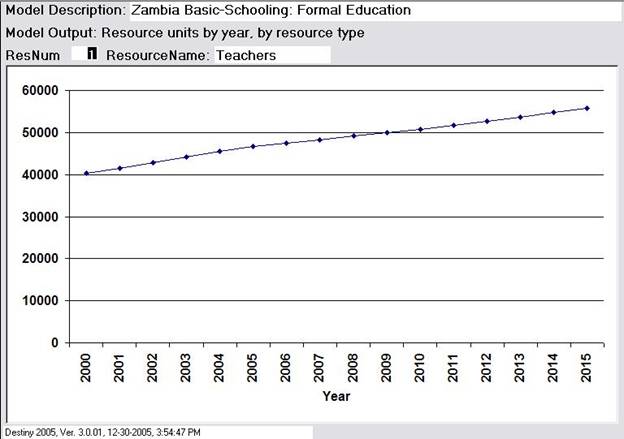
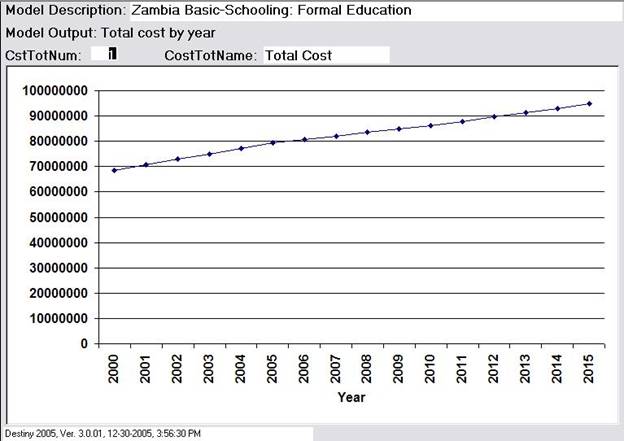
Model Output
Three output graphs are displayed below. The first shows the total target population (i.e., the population of official basic-school age, 7-15) over the projection period 2000-2015. The second shows the number of teachers by year and the third shows the total cost by year, under the assumptions that were made.
Cost of Using DESTINY
The cost of making a forecast includes three components -- the analyst time used in assembling the required data and in setting up the run (data entry), the computer running cost, and the program use charges (purchase or lease). For the DESTINY runs presented here, the analyst time was low (averaging about half an hour each for the last three, including both assembling the data and keying it into the system on the DESTINY data-entry screens). For more complex applications, the cost of finding useful data on incidences / prevalences and service-system parameters (utilization rates, unit costs) can be substantial. Once the required data are available, quite a number of examples can be examined in a short period of time.
The international version of DESTINY has been developed for use with the Microsoft Access database system. Through 2003, this system was included as part of the Microsoft Office suite of programs (Word, PowerPoint, Excel, Outlook and Access), so there is no added cost for acquiring the Access system if the complete Microsoft Office package has been acquired. (Some recent editions of Microsoft Office do not include Access, in which case it would be necessary to acquire it as a separate purchase prior to running DESTINY.)
A significant advantage of the international version of the DESTINY system is that it is not necessary to assemble any demographic or vital-statistics data for making cohort-component population projections – projections are already included in the system for most countries of the world. All that is required is to assemble the data required to make synthetic estimates based on the already-available population projection.
DESTINY runs are very fast, so that the amount of microcomputer time involved in making the projections is small – a few seconds each. Apart from initial data entry, the major component of analyst time is the time spent considering different model specifications (changes in structural parameters or parameter values).
The major cost component of DESTINY application is the cost of the analyst's time in assembling the required data and entering it into the system. Compared to data-intensive methodologies such as microsimulation, the cost of analyst time would be very low. Since DESTINY produces presentation-quality graphics in Microsoft Office format, it is not necessary to spend much time converting the system output to other uses (such as inserting in a Microsoft Word or PowerPoint document, or an Excel datasheet.
Joseph George Caldwell, PhD, developer of the DESTINY system, is a consultant specializing in program planning, evaluation, and policy analysis. His consulting career has included much work in studies, analysis, and system development in these disciplines, in a variety of application areas.
As president of Vista Research Corporation, he directed the project to develop the prototype MICROSIM microsimulation forecasting program for the US Department of Health and Human Services, and the Economic and Social Impact Analysis / Women in Development project for the Government of the Philippines.
He conducted needs assessment and client satisfaction surveys under the project, “Measuring the Effectiveness of Social Services,” for the State of West Virginia. He developed the sampling plans for a number of major nationwide surveys, such as the Survey of Institutionalized Persons, the Elementary and Secondary School Civil Rights survey, the National Center for Health Services Research (NCHSR) Survey of Hospital Costs and Utilization, the Profession Services Review Organization (PSRO) Data Base Development Study, the US Department of Housing and Urban Development (HUD) Housing Market Practices Study, and the Vocational Rehabilitation Follow-up Study.
He developed the sampling manuals for a number of government statistical reporting systems, including the Social Services Reporting Requirements (SSRR), the Office of Child Support Enforcement Reporting Requirements, and the Utilization Review of Medicaid; conducted cost-benefit studies of day care and alcoholism treatment centers; directed the Health Care Financing Administration (HCFA) study of the cost impact of Skilled Nursing Facility / Intermediate Care Facility (SNF/ICF) standards on nursing homes; and developed improved matching/allocation formulas for distributing funds to states under the Medicaid, Aid to Families with Dependent Children (AFDC), and Vocational Rehabilitation programs. He served as manager of monitoring and evaluation for the Egypt Local Development II – Provincial project, the largest local-level infrastructure development project in the world funded by the US Agency for International Development.
In the field of information technology, he developed the Personnel Management Information System for the Government of Malawi civil service, and the data processing and reporting component of the EdAssist Education Management Information System used by the Government of Zambia Ministry of Education (Academy for Educational Development / US Agency for International Development / Zambia Ministry of Education).
He developed TIMES, the first commercially-available general-purpose Box-Jenkins time series forecasting program, and the popular short course, “Sample Survey Design and Analysis.”
He is the author of several books, including The Value-Added Tax: A New Tax System for the United States and Can America Survive?
Dr. Caldwell received his BS degree in mathematics from Carnegie-Mellon University and his PhD degree in mathematical statistics from the University of North Carolina at Chapel Hill. He previously served as Director of Management Systems for the Bank of Botswana; as Manager of Research and Development and Principal Scientist at the US Army Electronic Proving Ground’s Electromagnetic Environmental Test Facility; and as Adjunct Professor of Statistics at the University of Arizona in Tucson, Arizona.
FndID(38)
FndTitle(DESTINY 2005 Demographic Estimation, Forecasting and Analysis System; Description of Capabilities, International Version3.0.01)
FndDescription(The DESTINY Estimation, Forecasting and Analysis System has been developed to provide the planner with a low-cost, easy-to-use means for making detailed forecasts of target populations, the need for services, the requirement for facilities, equipment, and personnel, and the cost under varying programmatic and demographic assumptions.)
FndKeywords(demograhic analysis; population projection; forecasting; population-based forecasts; small-area estimation; small-area statistics; synthetic estimation)